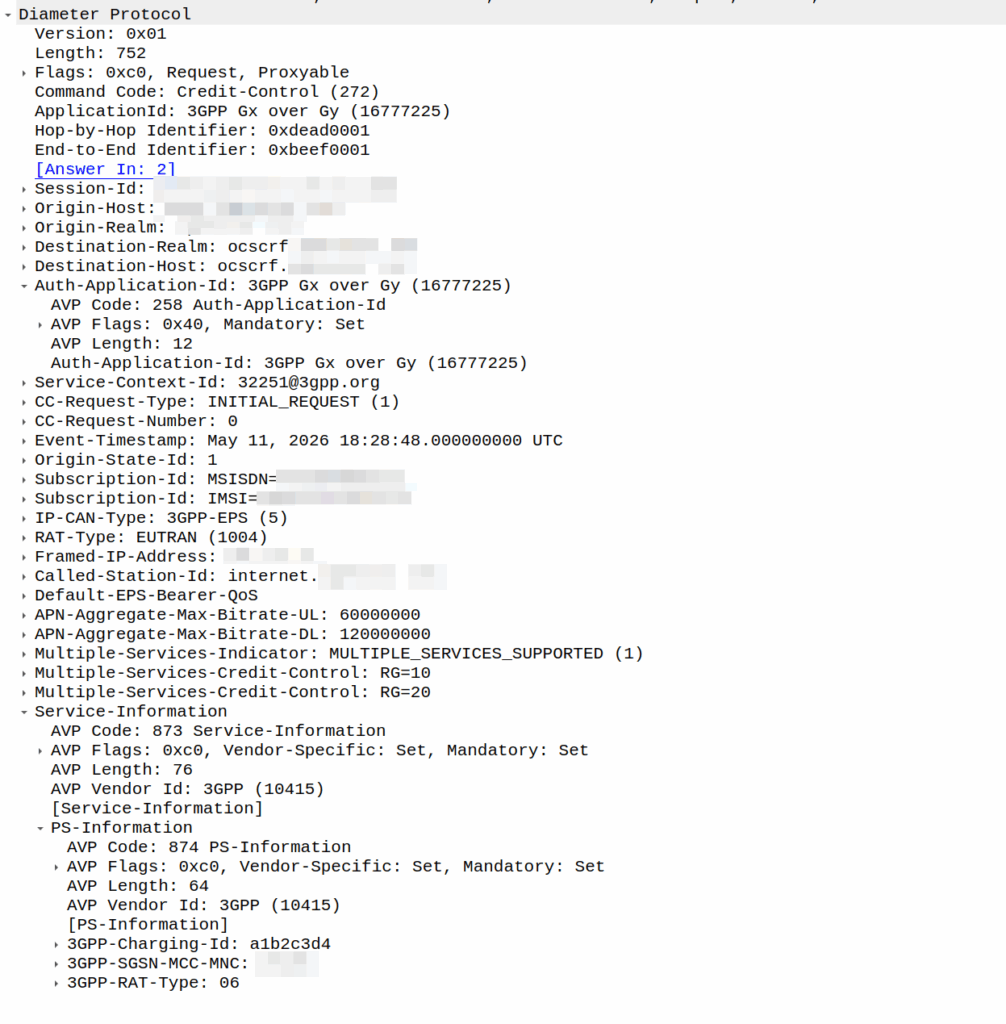
I was recently asked by a potential customer if we supported Gx over Gy.
I’d never heard of this before, so I gave my standard “If it’s in the spec we should support it, but I’ll check” answer, and got them to send me a PCAP, which I’ve got.
This is weird.
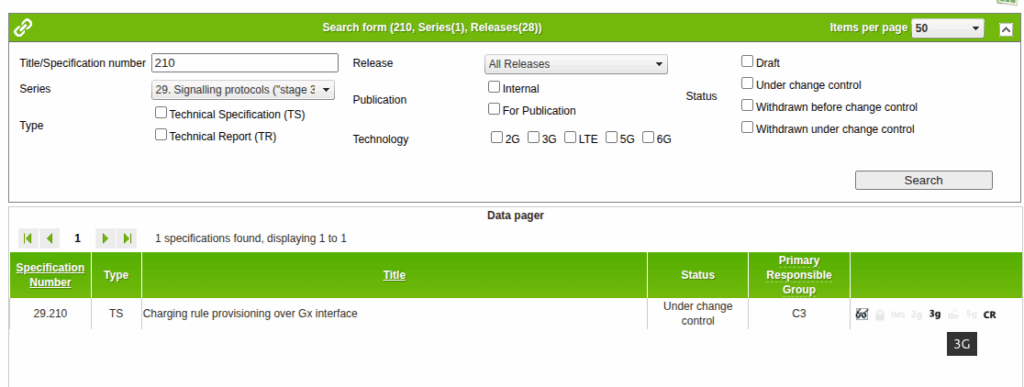
So for starers, Protocoldex has nothing for this application ID (16777225), even though it has all the LTE diameter specs.
The last version was from 2006, in 3GPP release 6, which is two years before LTE was standardized in Release 8. The word LTE does not appear in the doc or in the metadata tags.
It speaks of TPF (Traffic Plane Function) and TPF (Charging Rules Function).
LTE is “Long Term Evolution” – In later releases this draft TPF would evolve into the PGW (before the PGW-C / PGW-U divorce) and the TPF would go on to become the PCRF (and save spring break).
Reading through these early specs is like looking at Homo Eructs (get your mind out of the gutter) and knowing it evolves into Homo Sapiens.
So what does Gx over Gy do? Well, the concept is pretty straightforward, rather than needing a Sy interface between the PCRF and OCS, you can provision policy rules from the OCS, rather than on the PCRF.
So what network functions should implement this standard? Well, the P-GW specs do not reference this as something that’s included in the P-GW, nor is it in the GGSN – This was a “gooch” spec between the hypothetical standards land and real world implementations.
So will we be implementing it? Probably not. But an interesting bit of archaeology and a look through the genealogy of 3GPP.
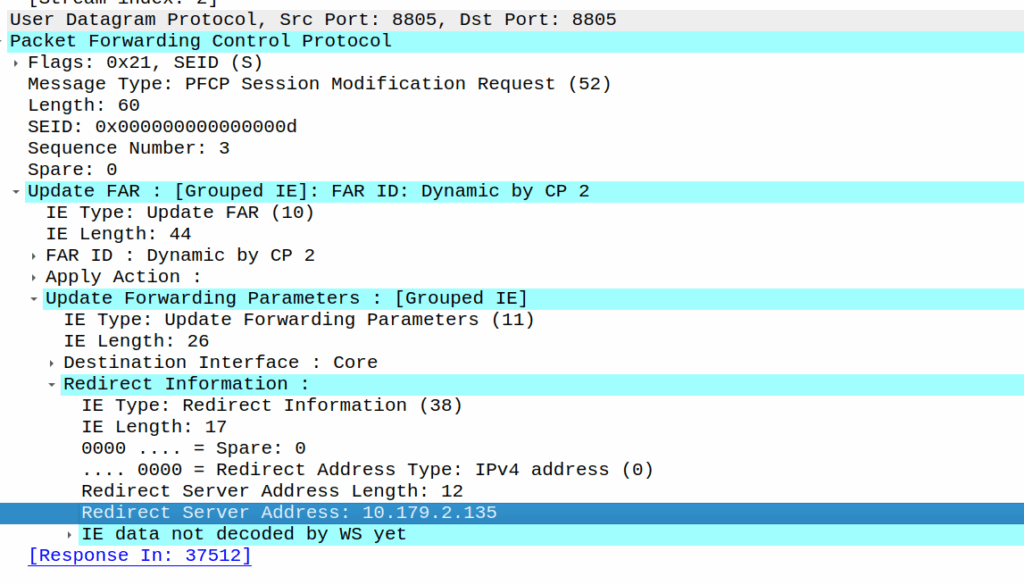
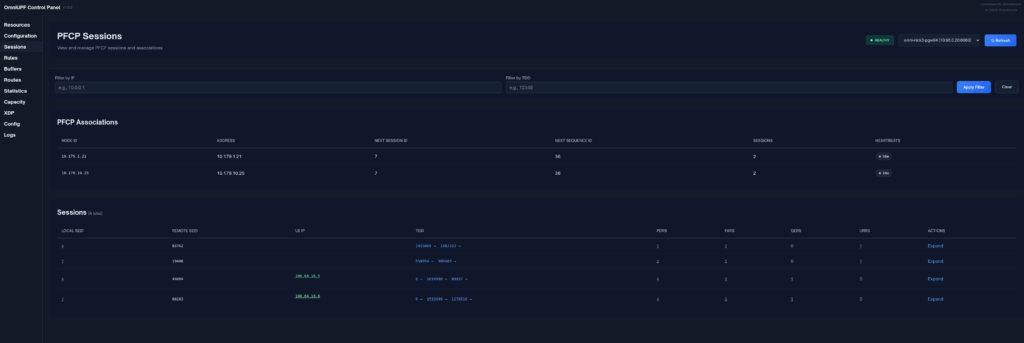
PFCP includes a “Redirect Information” IE, which if set, allows you to change the forwarding action in PFCP to Redirect traffic.
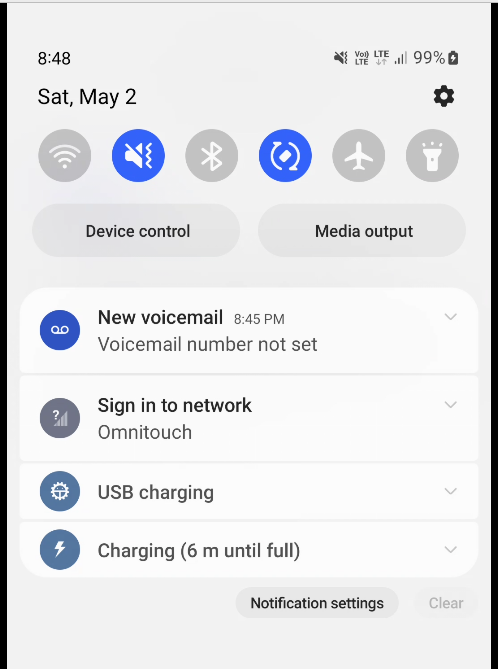
We use this for walled garden redirects, when the OCS reports credit exhausted to the PGW-C, the PGW-C can tell the UPF (PGW-U) that all the traffic from a given subscriber should be redirected to a captive portal / walled garden, like a “Topup Now Page” you’d be used to seeing on Airport WiFi.
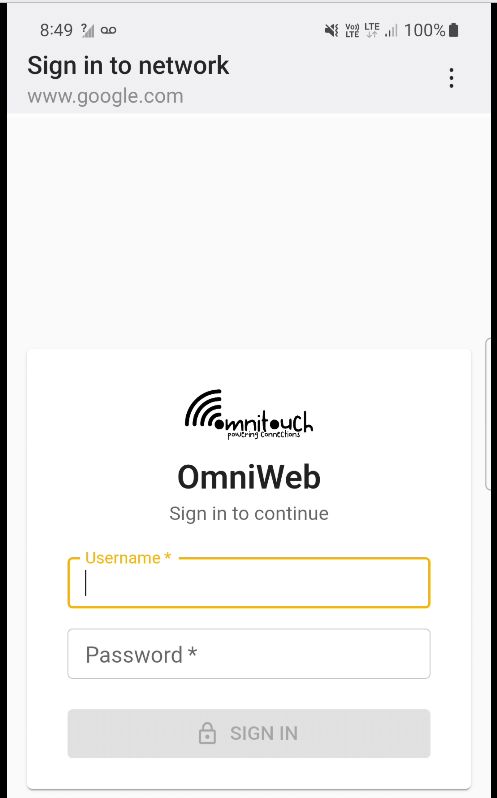
“Sign in to network” prompt presented on Cellular
Here’s what the spec says:
8.37. Redirect-Server AVP The Redirect-Server AVP (AVP Code 434) is of type Grouped and contains the address information of the redirect server (e.g., HTTP redirect server, SIP Server) with which the end user is to be connected when the account cannot cover the service cost. It MUST be present when the Final-Unit-Action AVP is set to REDIRECT. It is defined as follows (per the grouped-avp-def of RFC 3588 [DIAMBASE]): Redirect-Server ::= < AVP Header: 434 > { Redirect-Address-Type } { Redirect-Server-Address }
So how does this work in practice?
Once upon a time, you’d just intercept all HTTP request and serve your own content, but it’s not 2005 on Starbucks WiFi anymore, and SSL is everywhere.
Luckily this is a (mostly) solved problem, Apple has “Captive Network Assistant” that probes http://captive.apple.com/hotspot-detect.html and checks for a specific response, Google’s Android has http://connectivitycheck.gstatic.com/generate_204 and does the same thing.
But before I can tell you what we do, I’ll show you what we’re not doing before we do the doing so you can see what the do does by looking at what happens when we don’t – Clear?
Before we send any Session Modification Request with redirect I can do a DNS lookup, here’s an example from our test jig that goes to Facebook:
A Record lookup for facebook.com resolving to 57.145.8.1
This is just a regular A record DNS query wrapped up in GTP-U as it’d look from a eNB/gNB/SGW that gets an answer back also in GTP-U.
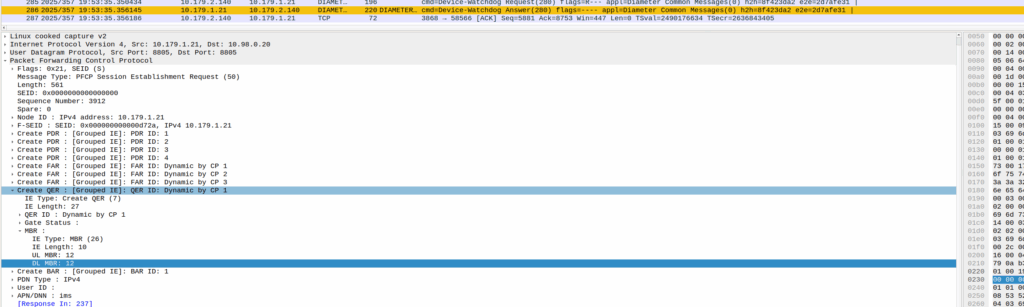
As we’ve already got a session up in our case, the SMF or PGW-C we sends the PFCP Session Modification Request I shared in the screenshot earlier to the UPF.
The Redirect Server Address in the Redirect Information IE in PFCP
We do a few things on the UPF at this point, the first, is that we block forwarding access to all IPs except 10.179.2.135 (The redirect server in the screenshot), and we steal / intercept all DNS queries.
This means if you query facebook.com after the Redirect Information is in place, you get back an A-Record answer for facebook.com but it’s telling you Facebook lives on our redirect server.
We’ve got a whitelist on our UPF for certain domains, so if we’re sending you to a self-signup page, you’re going to need to be able to hit our payment processors portals (Stripe, Paypal, etc), so we need to allow their domains, but we don’t know their IPs, so instead we do server side DNS lookups (via our DNS servers before you sneaky kids get any other ideas) for the whitelsited domains, and if it’s on our DNS whitelist, we allow resolution to those domains and allow access to those IPs returned in the DNS response.
In my lab I’m redirecting HTTP traffic to a management server
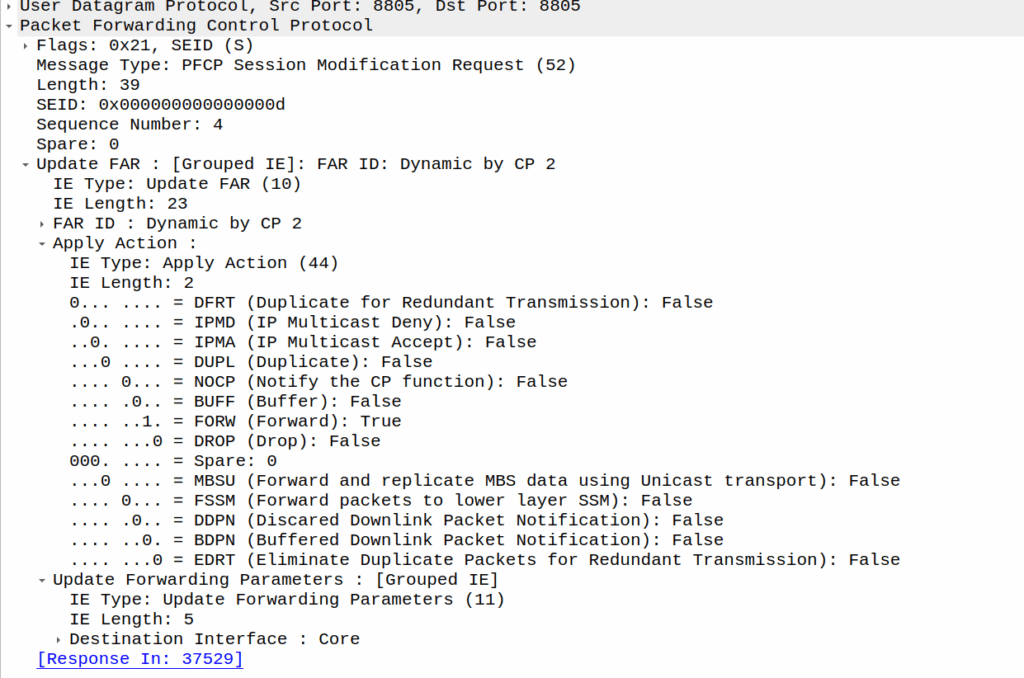
Turning it off just involves sending another PFCP Session Modification Request but without the redirect information.
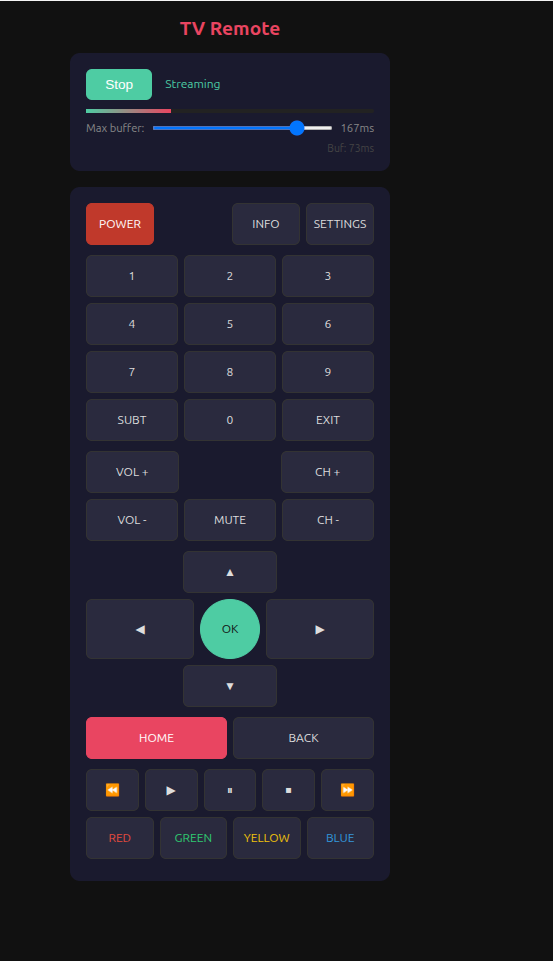
I’m trying to shift away from all the garbage that comes with so many Android app, the LG app that acts as a TV remote in particular caught my ire – You need to sign in and give it location permission just to control the TV, and stream the audio to my phone so I can listen with my headphones.
So instead I made a very hacky app to run on the telly, that does both, that I can access from any device.
I have run AMPS (1G) in my lab. I’ve run 2G (GSM) networks in production.
There’s a few dozen production LTE/5G networks out there I’ve put my stamp on, but…
Never, have I ever, run UMTS.
And that feels like a blind spot.
Sure, core wise 3G it reuses the 2G core (MSC / SGSN and friends). As a company, Omnitouch supports 2G, 4G & 5G networks – But we’ve never had the need to deploy 3G.
There’s a common theory that the odd-numbered “Gs” are shit. 3G/UMTS was crap, and 5G / NR standalone is kinda shit. There’s some merit to this theory.
3G/UMTS was a transitional tech, when it was worked on at the turn of the century, there was a growing recognition that this whole internet thing was going to be a big deal, but without the benefit of knowing exactly how people would use it.
In 2G, operators would configure on their networks how many “timeslots” were for voice calls and how many were for data. Imagine drawing a pie chart and rationing out this percentage for the internets, and that percentage for voice calls, and that’s pretty much how it went. The major difference (without going into the “CDMA” code thing) that 3G brought was that operators no longer had to decide the split of cat videos vs calls the network could decide the split.
Australia shut down GSM about a decade ago, and turned off UMTS close to two years ago, but many counties, including large parts of Europe, plan to operate 2G layers ’till the 2030s. While UMTS/3G survived ~20 years, GSM will be in it’s 40s at the point where it’s shut off in many countries.
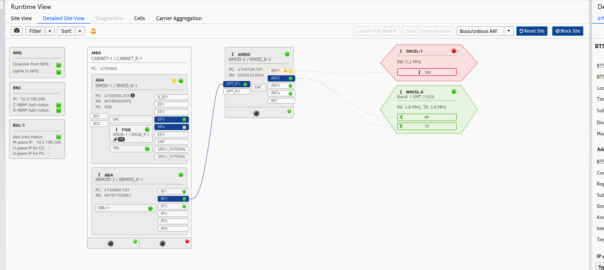
As what my partner somewhat lovingly refers to as a “school holiday project” (Pointless thing I do rather than relaxing like a normal person) I set about trying to build an RNC – A “Radio Network Controller” the UMTS equivalent of a Base Station Controller in GSM, that I could connect to OmniMSC.
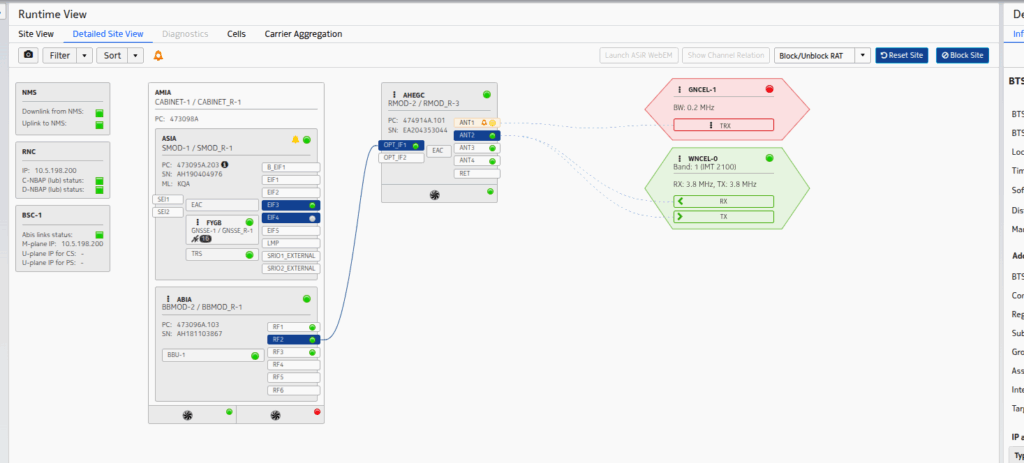
So I fired up the Airscale, configured an Iub link and looked at what it sent.
And the answer was a big fat nothing – the first rule of fight club is that the RNC initiates the connection.
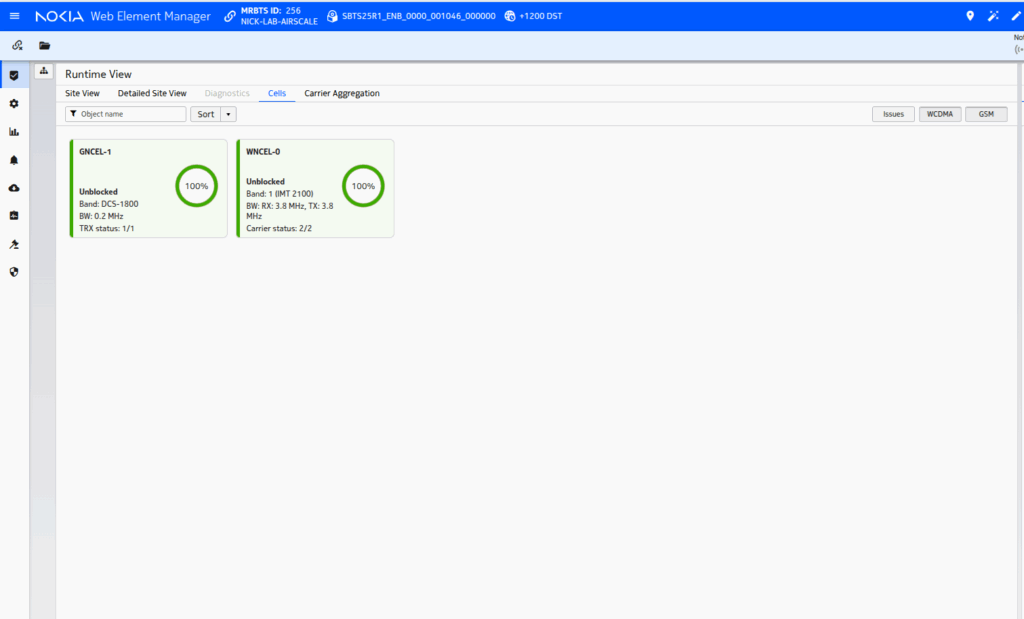
I limped the project along to the stage where I had the cell reporting “Up” and visible, but to actually attach phones started to get into the CDMA part of allocating codes, and real life started to catch up with me.
Perhaps someday I’ll continue the work, but the sad truth is there’s almost no scenarios today where you wouldn’t be better to deploy LTE and a GSM layer if you need to support legacy devices – the smallest UMTS carrier is 5Mhz, and while you can’t do 1:1 frequency reuse in GSM, you’ve got 20x unique GSM TRXes in that same 5Mhz you can use.
So for now, I’m giving up, knowing slightly more about RNC architecture, but still having never done a UMTS attach.
One of my favorite things about Ansible and network automation as a whole is that I can do things in a repeatable manner, super quickly.
One of the worst things about network automation is I can uniformly break things super quickly.
Recently I was working on spinning up a core for a customer, who had some funky VPN stuff, which meant I’d needed to jump traffic through a jumphost (no biggie).
But I’d set ControlPath in my ansible.cfg file with %%h but that’s escaped as %h in the SSH config, except my ansible.cfg is not the same as an SSH config, so it passed it literally.
Protip: It’s just %h not %%h.
This meant it when Ansible created the socket, it didn’t fill with target hostname, so I had a single socket, which happened to be created on the first VM that we connected to (not consistent).
Then all the other commands for all the playbooks were run on a single VM that the socket was on, while Ansible reported it was running the roles and tasks across hosts it wasn’t, as everything was happening on one host.
This was, very confusing to debug.
If I sshed into box X, it’s hostname would show box Y, and it’d have the roles deployed from box Z.
I’ve no idea if anyone else will make the same stupid mistake as I did today, but I probably will, so I wrote this done.
One of our customers is an MVNE and they reached out the other day with an issue.
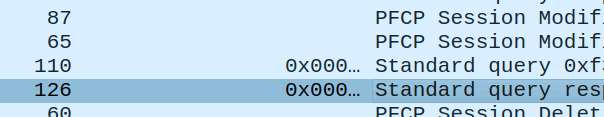
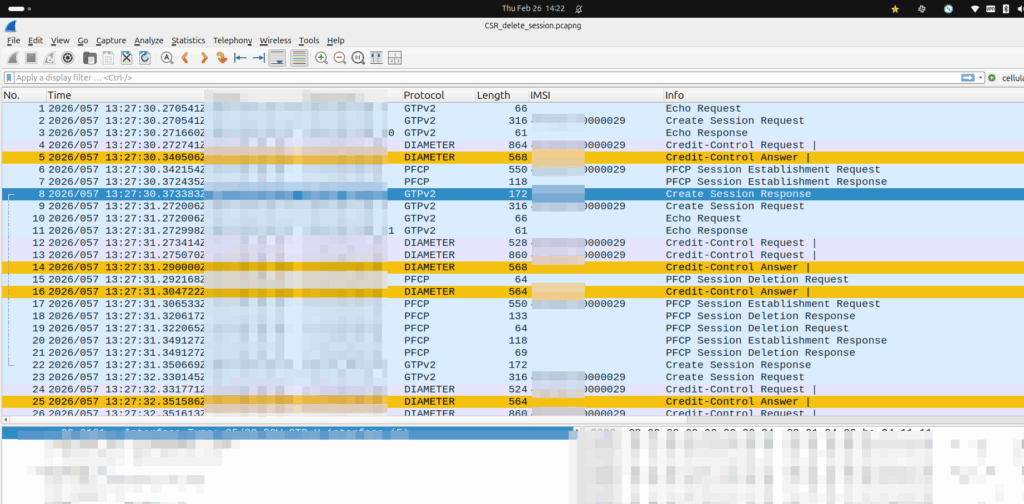
They were turning up a new PGW and they’d see Create Session Request, everything looked OK, it’d get a response, but then in the GUI of the PGW-C they’d see the session drop.
The logs showed the newly setup session dropping shortly after being setup.
Have a look at the screenshot and see if you can work out why:
So what’s going on, and why is the PGW-C deleting sessions?
The initial reaction from the customer was there’s something up with the PGW, but the answer is bit more nuanced.
Per the specs, you can’t have two PDN sessions for the same subscriber (IMSI) on the same APN (DNN).
So if 50557000000001 is connected to the PGW-C on the internet APN, if I send another Create Session Request to the same PGW-C, it deletes the old session, before starting the new one.
In this case, the MVNE it was going through was dropping the Create Session Response, so it never made it back to the MNO, and then the MME in the MNO sent it again.
Joys of GTPv2-C being UDP based and connectionless!
Our team recently shipped a new UPF which is a huge improvement on our old UPF, and I drew the short straw of doing all the interop testing for the IMS.
Initially I thought there was an issue with IP routing, as I’d never see the SIP register from the UE, but I would see the IMS APN coming up.
I could access the internet from the UE IPs just fine, but that’s going to public IPs, whereas the P-CSCF is in private address space, and hosted on the same box as the UPF.
I spent hours on this as my lab servers do routing on a stick, and I thought some hardware offload somewhere was trying to fast path my packets and send them back to the server without going via the router.
Then I dug a little deeper and found I could see the 3 way handhake between the UE an the P-CSCF, but no SIP packets.
Successful 3 way handshake between the UE and the P-CSCF on TCP 5060
This was confusing, clearly we had at least intermittent two way comms – the 3 way TCP handshake confirmed that, but then why were packets not getting across?
We have an XCAP server hosted on our P-CSCF instances, so I tried hitting that from the phone in case there was something weird about routing to the network segment that hosts the P-CSCF, but I could hit the XCAP server just fine, so now I was certain the UE IP pool could route to the P-CSCF and 3 way handshake for TCP was working and payload could be pushed.
Clearly we can route to the P-CSCF as that’s where this XCAP server is hosted
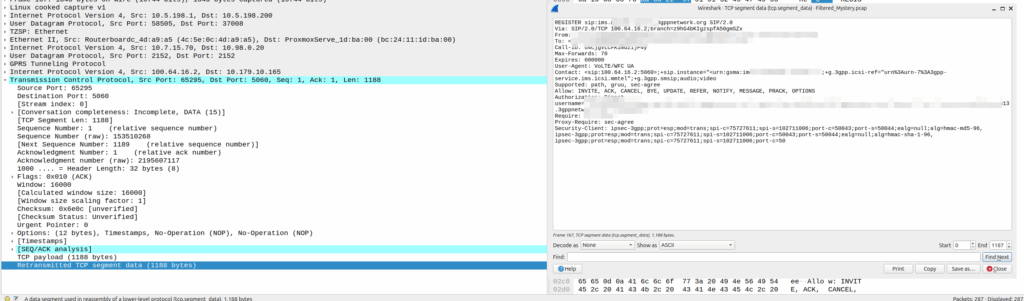
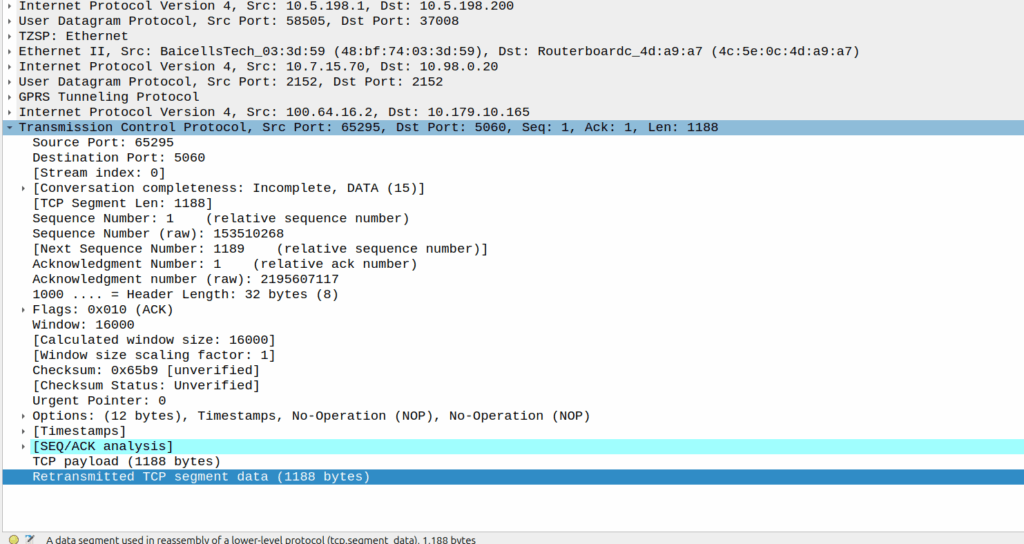
Then I dug into what happened after the 3 way handshake, and I found a TCP payload containing the start of the SIP REGISTER.
Hmm, we have a SIP Fragment here at least…
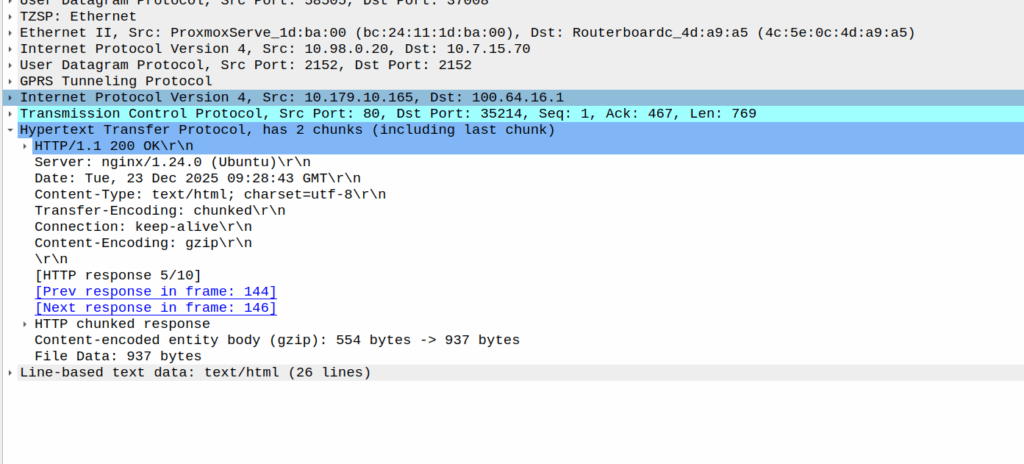
I traced it all the way through and lo, it’s hitting the P-CSCF:
And the fragment is recieved on the P-CSCF
Okay, but then what happens, because it’s only a fragment, not the complete re-assembled packet, so what’s going on?
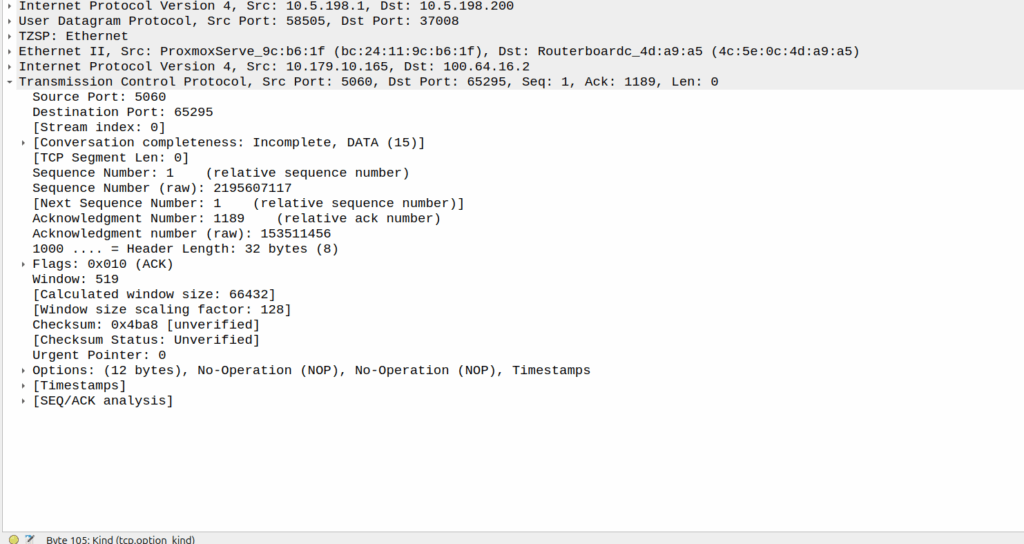
Well, the P-CSCF sends a TCP ACK back to the UE.
And the TCP fragment containing the first part of the REGISTER gets an ACK back from the P-CSCF
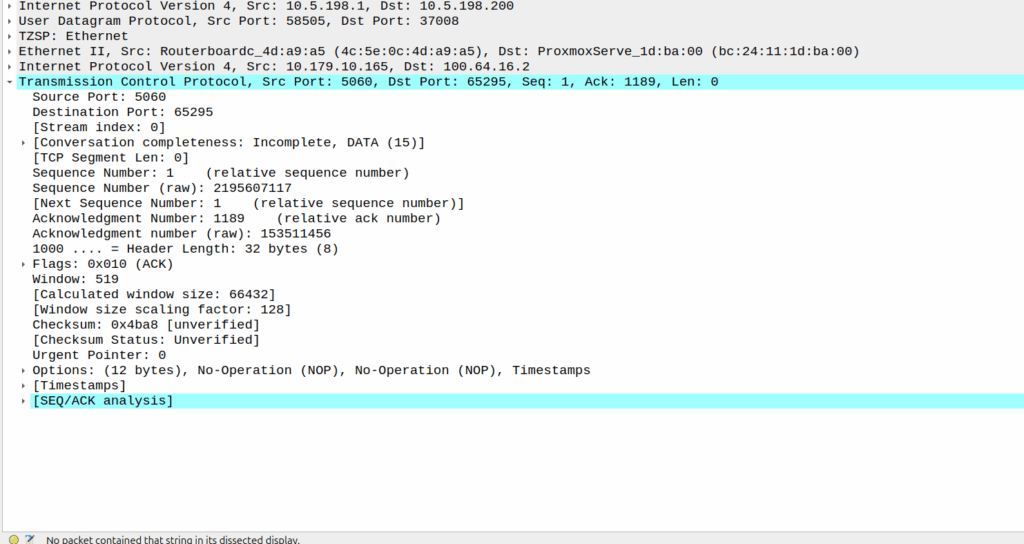
The ACK gets forwarded to the UPF:
And that TCP ack makes it to the P-CSCF
And then… Nothing? The UPF never encaps the TCP ACK back into GTP-U and never sends it onto base station.
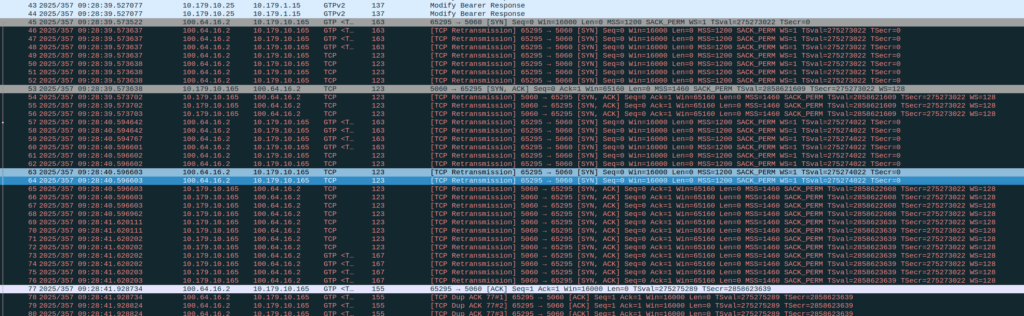
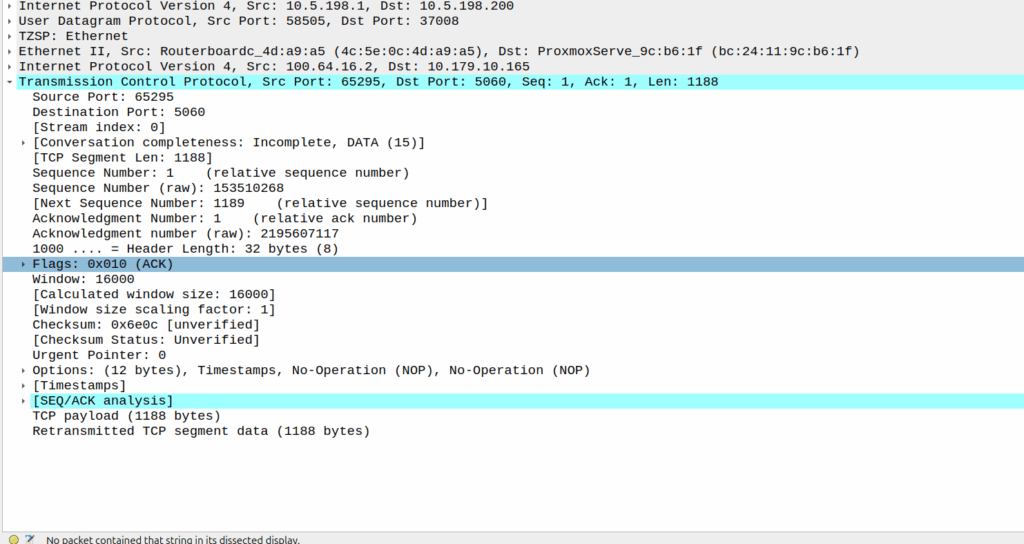
Eventually the UE re-sends the payload with the start of the REGISTER, but it does not get the ACK from the P-CSCF.
Retransmitted TCP segment containing the REGISTER from the UE
So naughty UPF right? Not forwarding that ACK for some reason?
I started digging, maybe the ACK was getting routed weirdly and landing on the UPF without going through the router?
Well not quite…
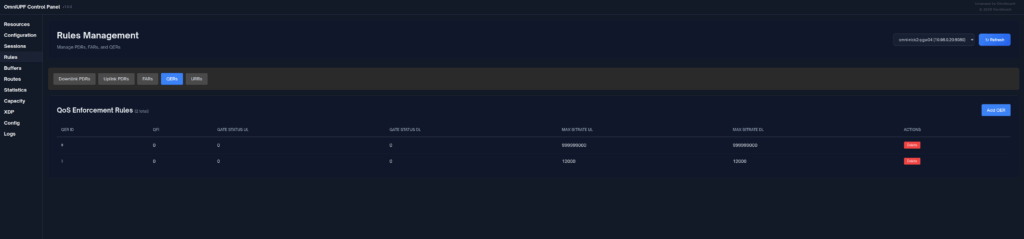
When I started digging into the QER rules being installed I noticed the MBR bitrate we had on the IMS APN in the HSS was tiny.
The UPF can only gate on traffic to the UE, so was gating the ACK traffic, as the QER had consumed all the bandwidth so the ACK never made it back.
Time wasted – About 4 hours, but I will not make this mistake again!
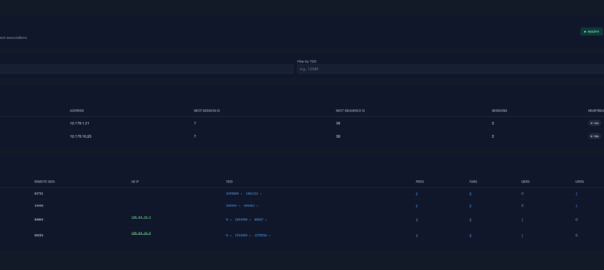
SMSc can send an SRI-for-SM, and if the subscriber is absent, the response can include the informServiceCenter message, which lets the SMSc know if it will get sent an alertServiceCentre message when the subscriber comes back online (sends an UpdateLocation).
This means that the SMSc can be notified when it can deliver the message to the subscriber.
It’s got a bunch of flags, which equate to:
sc-AddressNotIncluded means the service center address from the SRI-for-SM was not included in the Message Waiting Data file (and therefore will not get notified via AlertSC when the subscriber comes back online).
If it’s sc-AddressNotIncluded is set to False it means that the service center address has been added to the Message Waiting Data file, so will get an alertServiceCenter message when the sub comes back online (Double negative).
mnrf-Set means Mobile subscriber Not Reachable (Not registered on any MSC)
mcef-Set means Memory Capacity Exceeded Flag is set as the HLR has run out of memory in the Message Waiting Data file and cannot store any more data (So you won’t get notified via AlertSC when the subscriber comes back online)
mnrg-Set is for Mobile subscriber Not Reachable for GPRS (When using SGSN delivery is not registered for packet service).
mnr5g-Set means the SC will get notified when the subscriber becomes reachable from 5G serving nodes.
mnr5gn3g is a mystery – The only references to it I can find are in the ASN1 spec (hence why Wireshark decodes it) but as to its purpose, I can only guess.
This one replaces nicktest.com with mobile.operatorx.numberportability.local and after that replaces 10.171.2.134 with fixed.operatorx.numberportability.local
I’ve been facing an issue in Vscode for a long time where when I’ve printed a lot of data to the terminal, everything gets really unresponsive – Scrolling through the results is like I’m drunk it’s so unresponsive, and I’ve tried a bunch of stuff to fix it.
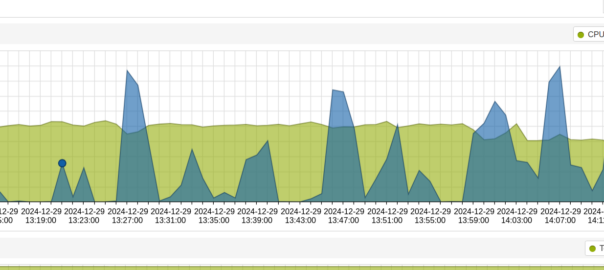
Here’s the Benchee benchmarks for a function in Elixir that happens to print a lot of data to the terminal, if I run it in Vscode:
A meagre 12.4 IPS on that function, but not only that but I see the CPU usage spike and the computer becomes unsuable.
But if I run in Ubuntu’s default terminal (GNOME Terminal):
5 fold increase and I don’t even see CPU spike above 30%.
So what gives?
Here’s what I’ve tried:
Disable hardware acceleration
Change scrollback limits in VScode
Changed scrollback limits in the terminal
Removed all extensions
Defaulted config
Same thing.
Still stuck, I was kinda hoping this would be a “here’s how I fixed it” post. But it’s not. Sorry hopeful people with the same issue, I’ll update this if I ever get to the bottom of it…
I started this blog when I got my first job – I was installing Nortel equipment. The name was meant as “Nick versus Networking”, as I attempted to take on the trade and learn it.
Going through CCNA, networking certs, I got way more into SIP/VoIP, I discovered Asterisk, which got me into FreeSWITCH, which eventually got me into Kamailio, all of which I wrote about as I went, as I learned stuff, I wrote it down. A few years later I somehow landed a job as “Senior Voice Engineer” for a carrier, in no small thanks to the blog, and built all the things; automated stuff with Ansible, pushed around data with Python and built production infra with FreeSWITCH and Kamailio, again, lots of posts around this time on those topics.
Eventually I got a bit bored at fixed line voice, so I made the move into Mobile, again, reflected in the blog posts.
I bought an eNodeB, built an HSS and got a functioning lab setup for 4G and VoLTE. That landed me a job at systems integrator working on packet core, then I moved to a solution architect role for one of the big RAN kit vendors looking for more challenges, but sadly I didn’t find enough challenges to keep me interested.
So I accidentally started a company (Omnitouch) and now find myself working with a bunch of super talented folks to build mobile networks in weird and wonderful parts of the planet.
All along I’ve been learning new stuff, and writing about it, and somewhere along the way, I found time to write 500 blog posts about all the bits I’ve learned as I went along, if you’ve been reading along, thanks, hopefully you found something interesting, and I’ll see you again at post number 1000 in another decade!
Disclaimer: This is in a lab held together with duct tape and glue that doesn’t do anything important. Use at your own risk.
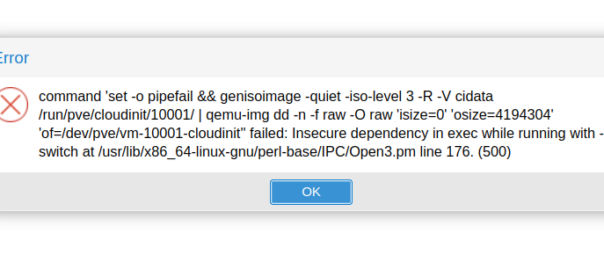
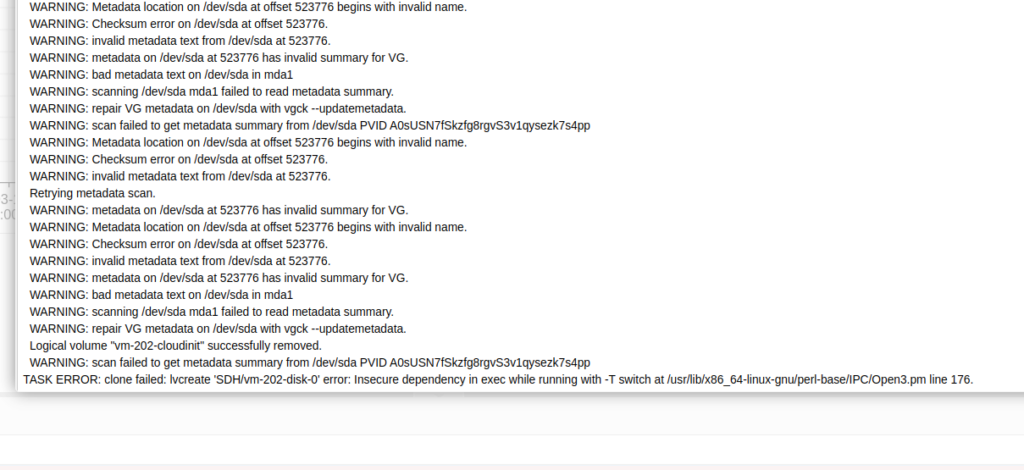
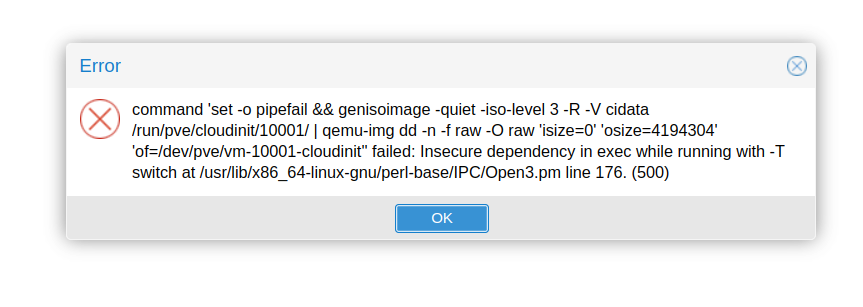
I hit this issue in Proxmox whenever trying to do anything with VMs:
TASK ERROR: clone failed: lvcreate ‘SDH/vm-202-disk-0’ error: Insecure dependency in exec while running with -T switch at /usr/lib/x86_64-linux-gnu/perl-base/IPC/Open3.pm line 176.
I’m not a Perl user, but Google tells me that it’s because Perl is set to operate in Taint mode thanks to the -T parameter.
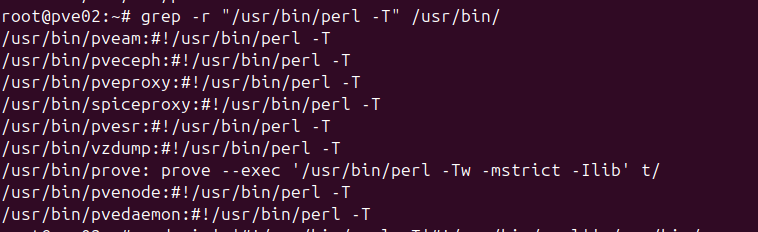
The file it’s referencing doesn’t actually contain the -T parameter, so I went looking and sure enough a bunch of the Proxmox services contain the -T parameter.
Ah access to source makes debugging so much easier!
So a hacky one liner to remove the -T in those files:
And presto, whatever important security feature and flag that never should be turned off is gone, and my Frankenstein lab lives to operate another day.
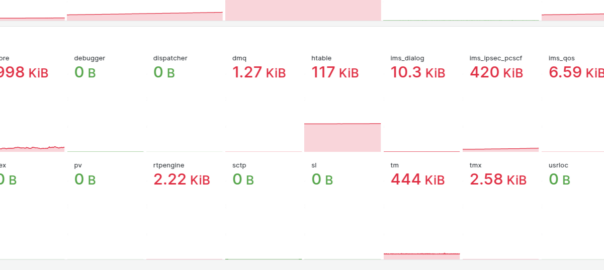
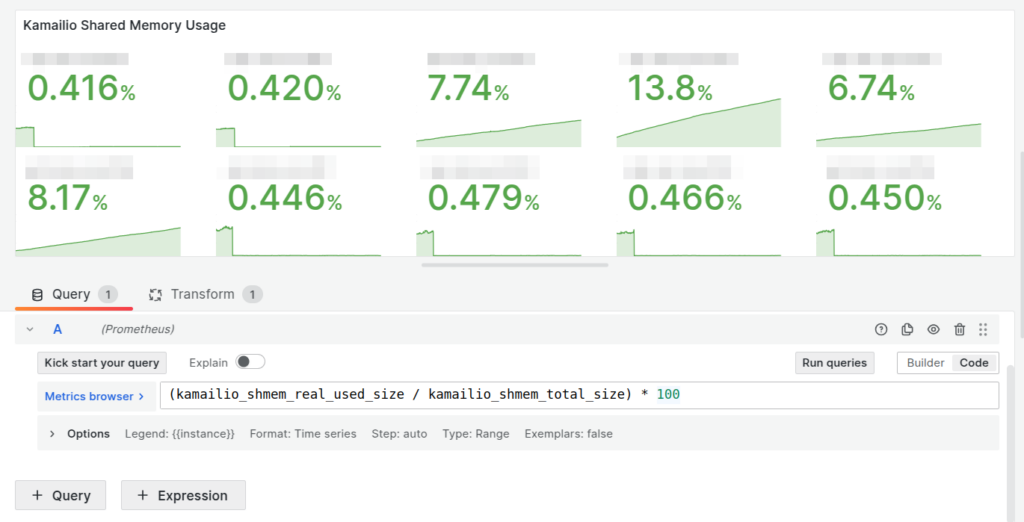
Our dashboards showed this slow memory leak, with the memory slowly ticking up on a certain group of machines, we knew there was a memory leak, but in which Kamailio module?
Shared memory usage per Kamailio instance
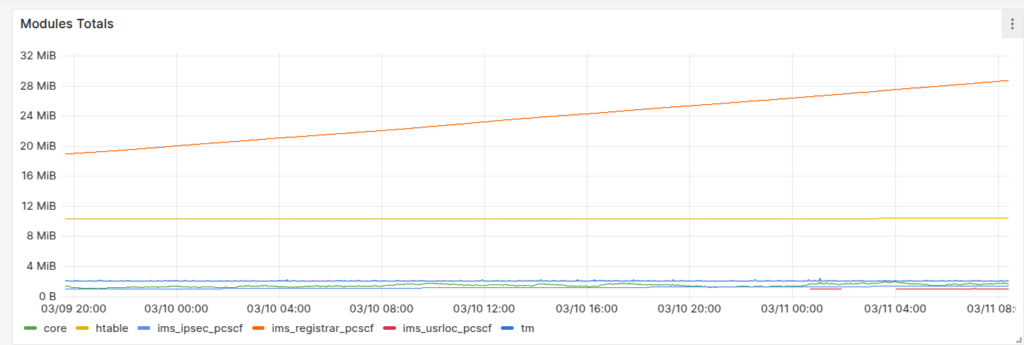
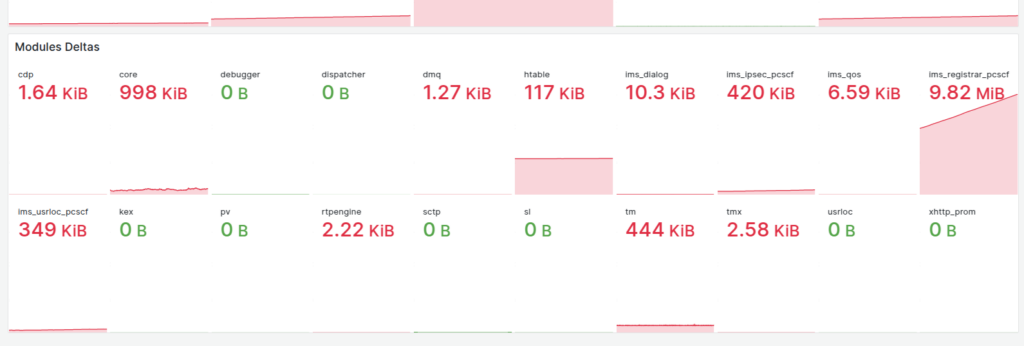
So we know there’s a memory leak on some boxes (different boxes run different modules) but which ones?
kamcmd will show you a breakdown of the shared memory usage per module, so I started with a little cronjob to dump the data every so often, with the idea I would diff the values and look for big increases.
Then the idea of processing the data from the files started to scare me.
So in the end I went overboard and wrote a little script to get the memory usage of each module and export it via Prometheus, so I can track down what module is at fault.
If I were a better C programmer I’d have added this into the main Kamailio Prometheus module, but I’m terrible at C.
Clutter data describes real world things on the planet’s surface that attenuate signals, for example trees, shrubs, buildings, bodies of water, etc, etc. There’s also different types of trees, some types of trees attenuate signals more than others, different types of buildings are the same.
Getting clutter data used to be crazy expensive, and done on a per country or even per region basis, until the European Space Agency dropped a global dataset free of charge for anyone to use, that covered the entire planet in a single source of data.
So we can use this inside Forsk Atoll for making our predictions.
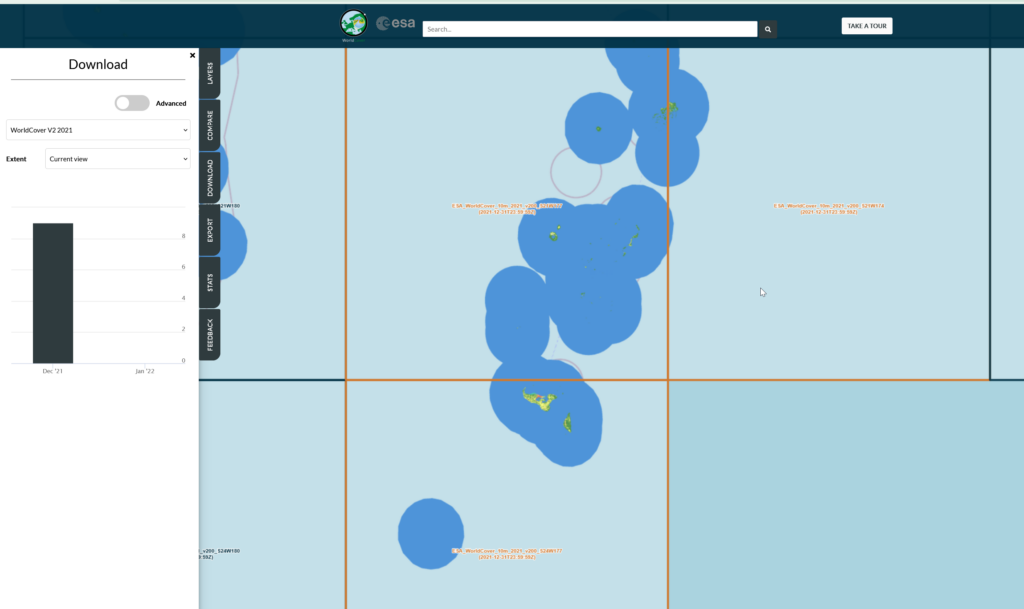
First things first we’ll need to create an account with the ESA (This is not where they take astronaut applications unfortunately, it just gives you access to the datasets).
Then you can select the areas (tiles) you want to download after clicking the “Download” tab on the right.
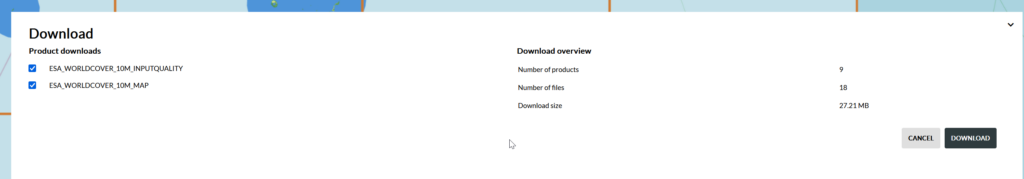
We get a confirmation of the tiles we’re download and we’ll get a ZIP file containing the data.
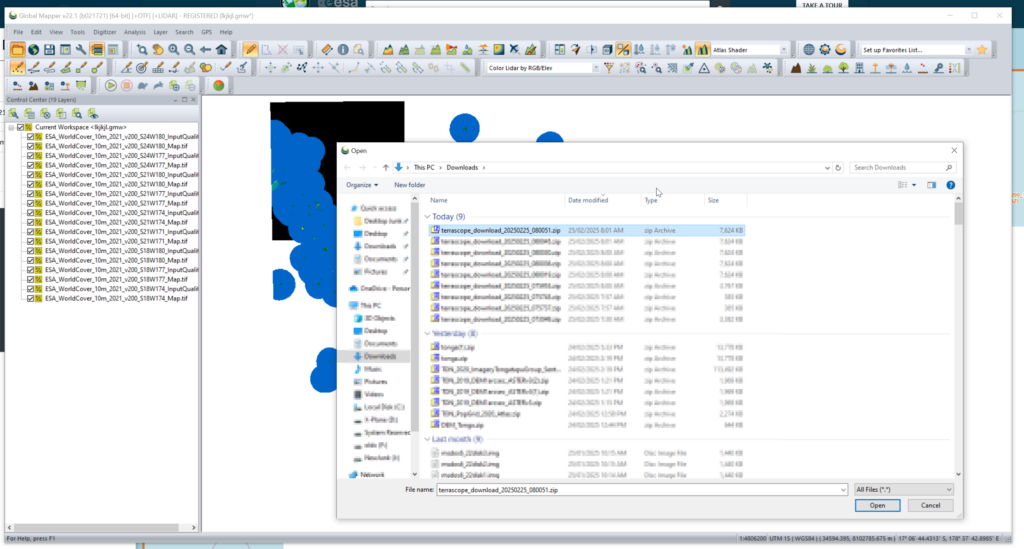
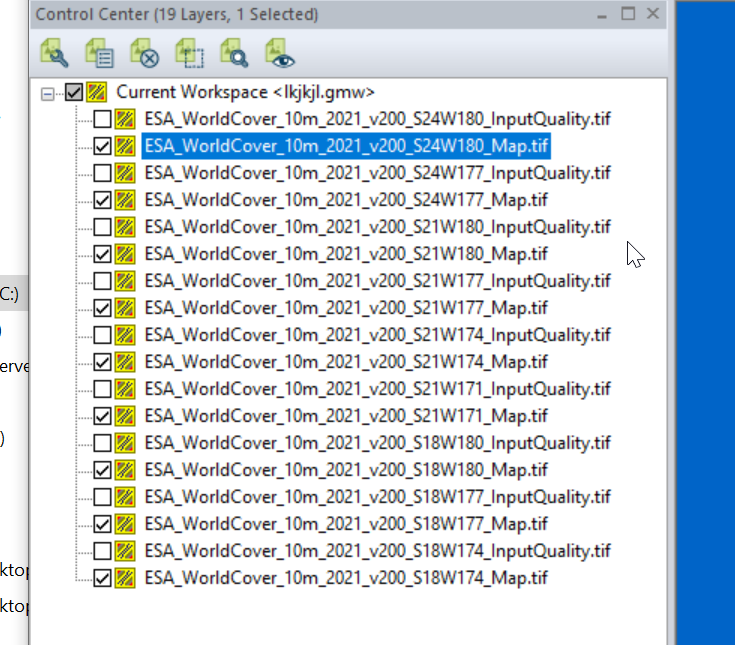
We can load the whole ZIP file (Without needing to extract anything) into GlobalMapper which loads all the layers.
I found the _Map.tif files the highest resolution, so I’m only exporting these.
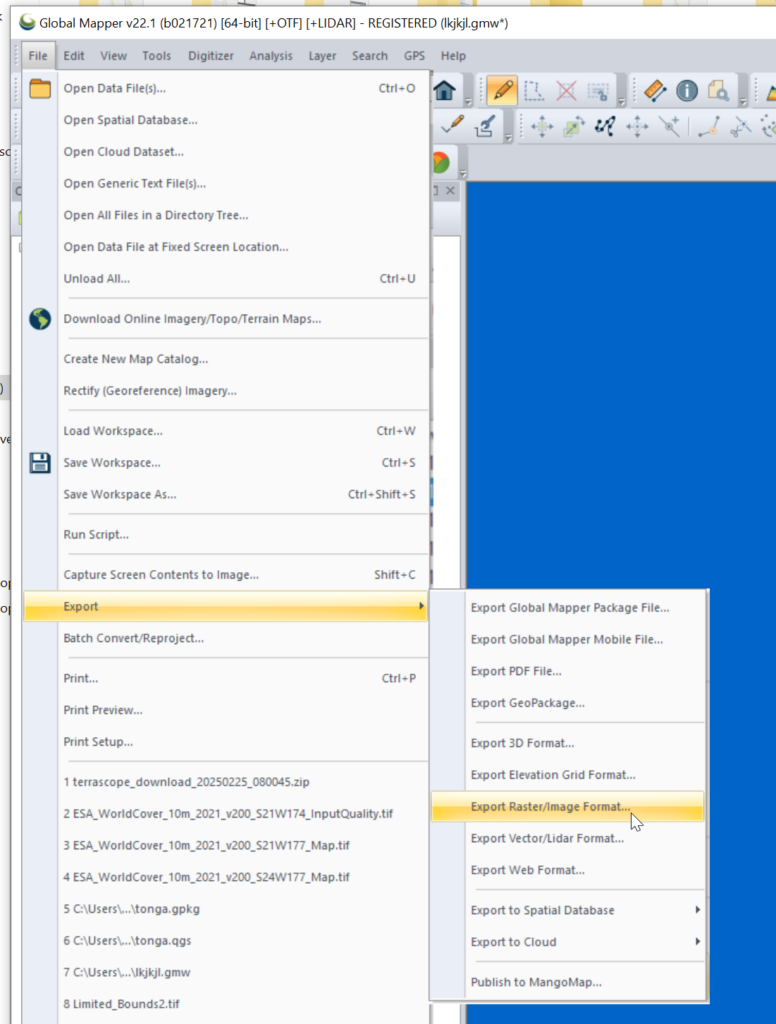
Then we need to export the data to GeoTiff for use in Atoll (The specific GeoTiff format ESA produces them in is not compatible with Atoll hence the need to convert), so we export the layers as Raster / Image format.
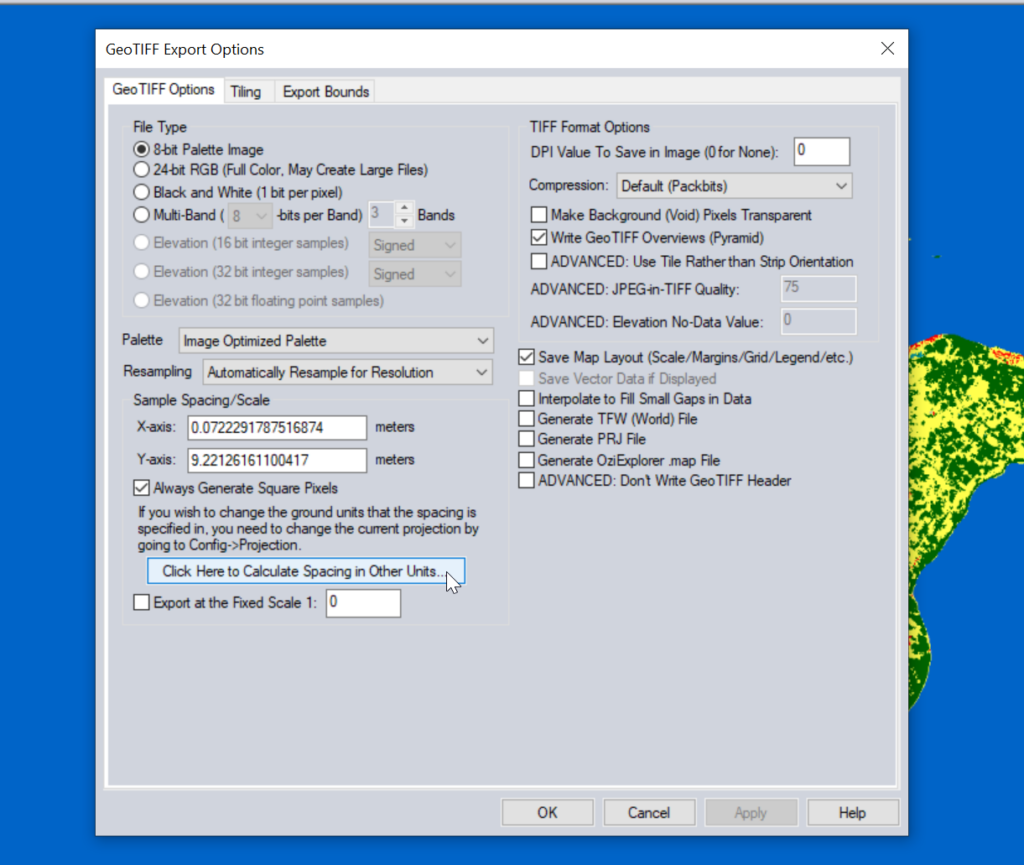
Atoll requires square pixels, and we need them in meters, so we select “Calculate Spacing in Other Units”.
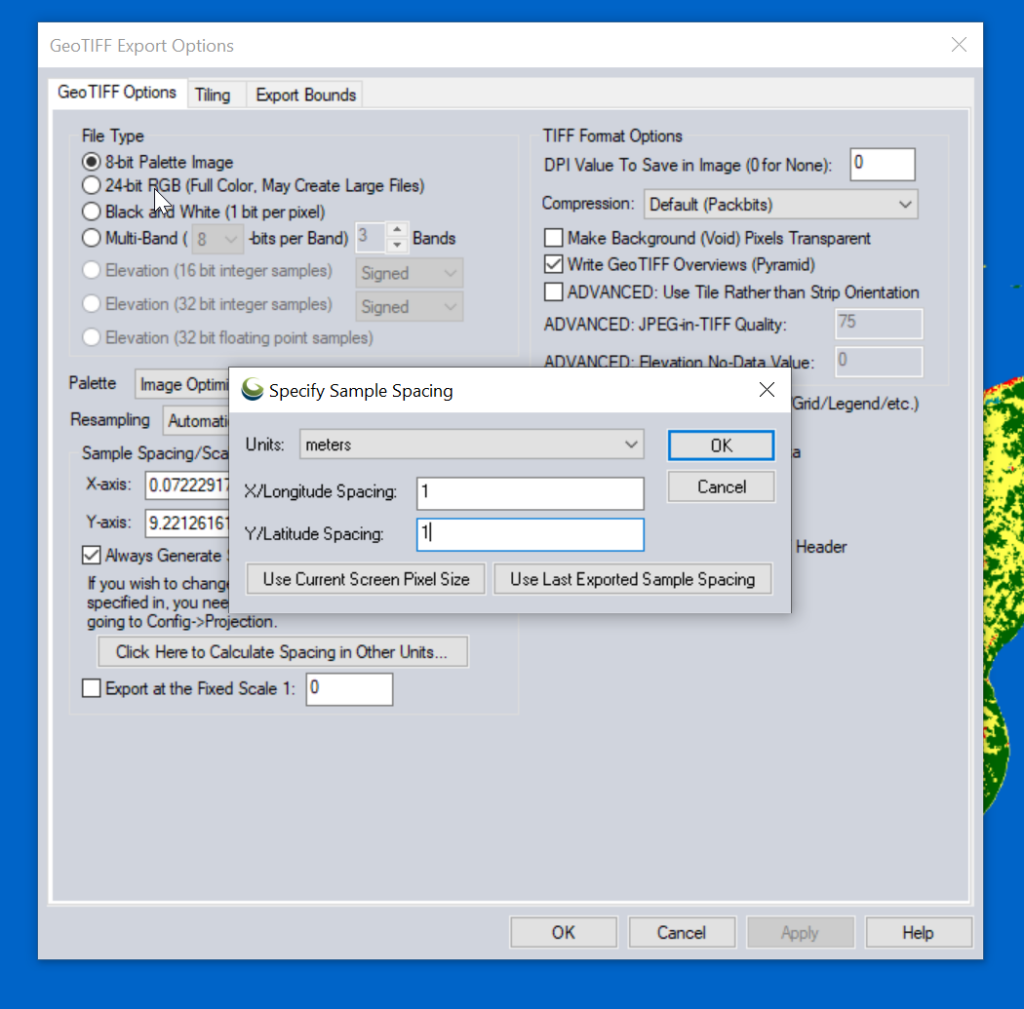
Then set the spacing to meters (I use 1m to match everything else, but the data is actually only 10m accurate, so you could set this to 10m).
You probably want to set the Export Bounds to just the areas you’re interested in, otherwise the data gets really big, really quickly and takes forever to crunch.
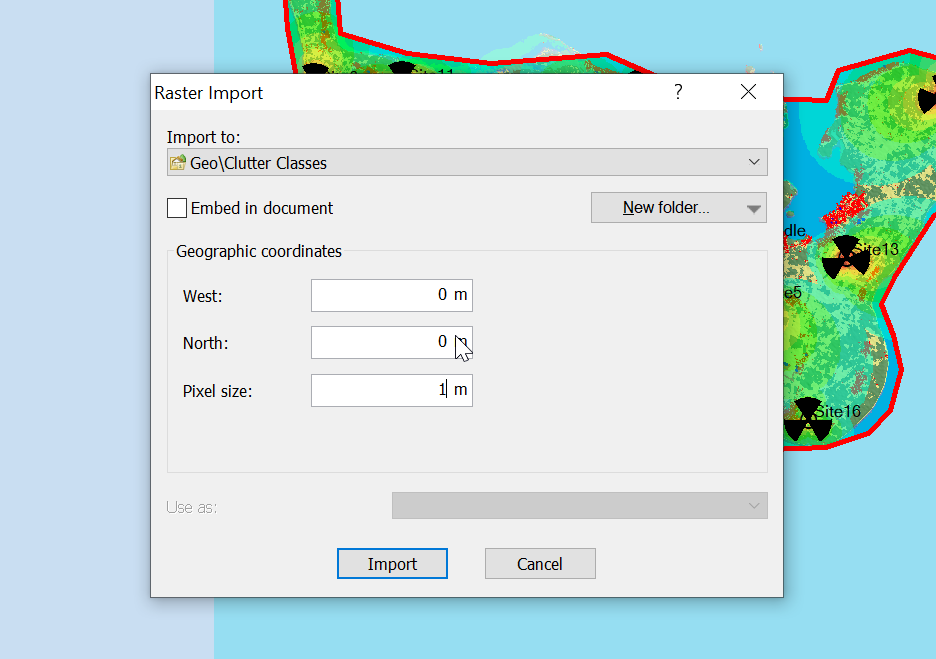
Now for the fancy part, we need to import it into Atoll.
When we import the data we import it as Raster data (Clutter Classes) with a pixel size of 1m.
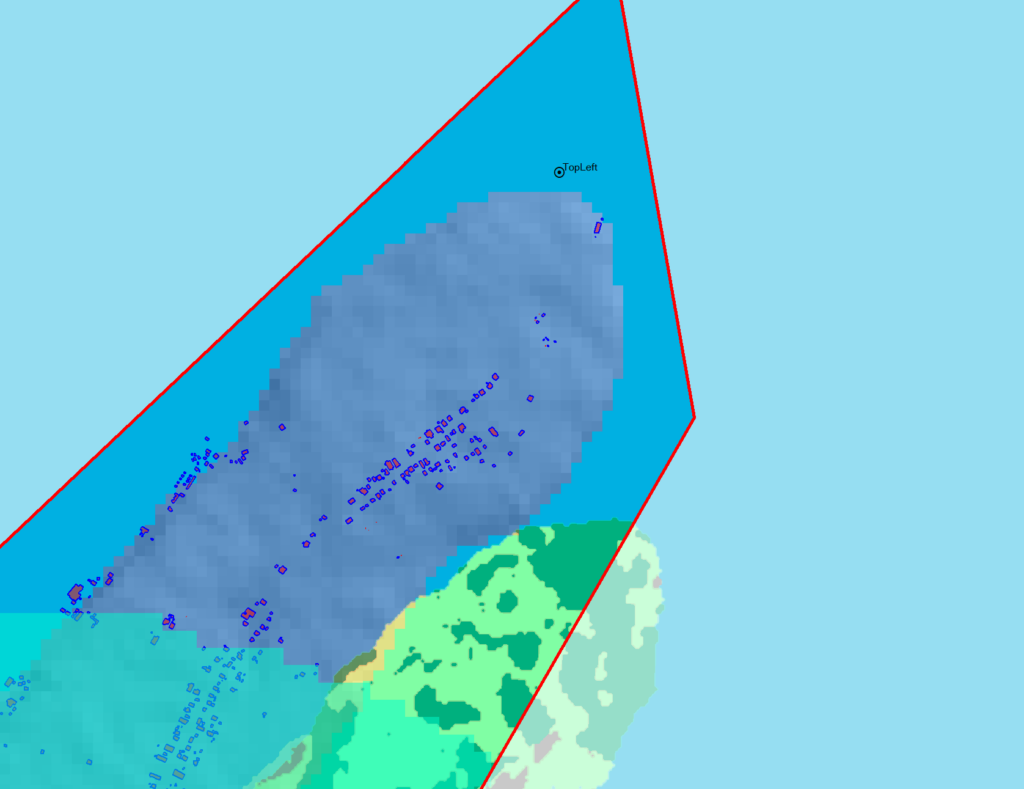
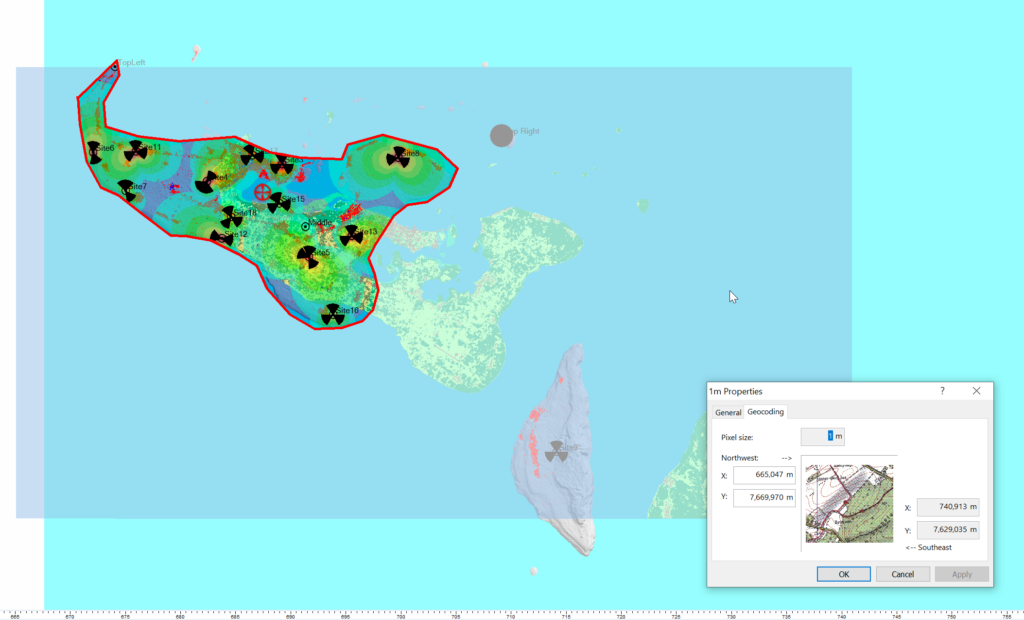
Alas when we exported the data we’ve lost the positioning information, so while we’ve got the clutter data, it’s just there somewhere on the planet, which with the planet being the size it is, is probably not where you need it.
So I cheat, I start put putting the West and North values to match the values from a Cell Site I’ve already got on the map (I put one in the top left and bottom right corners of the map) and use that as the initial value.
Then – and stick with me, this is very technical – I mess with the values until the maps line up into the correct position. Increase X, decrease Y, dialing it it in until the clutter map lines up with the other maps I’ve got.
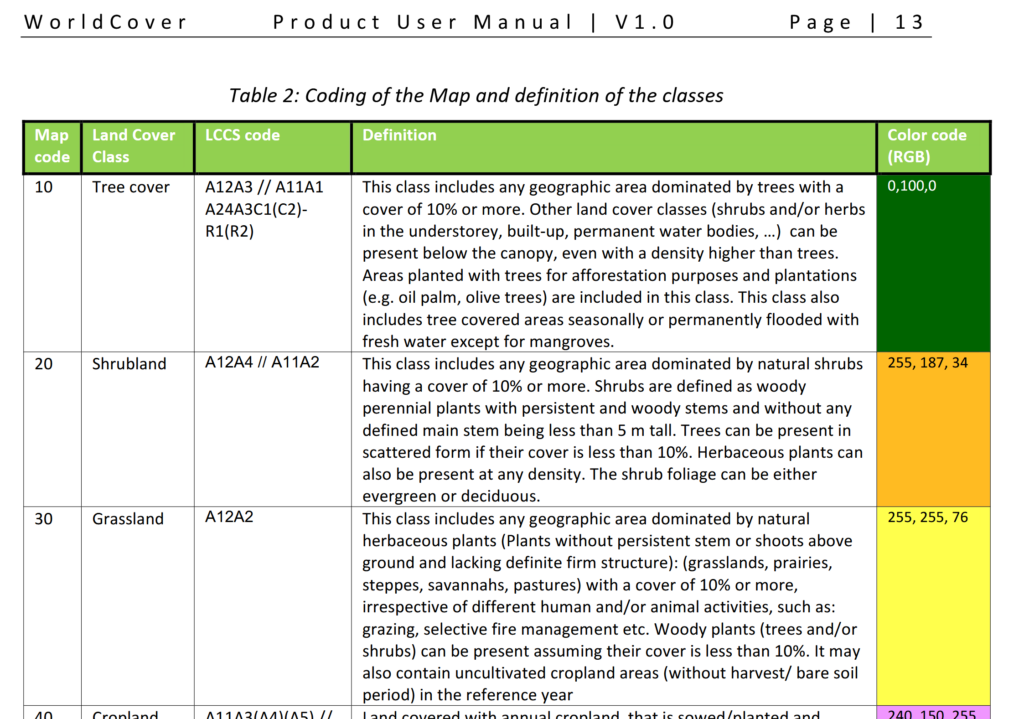
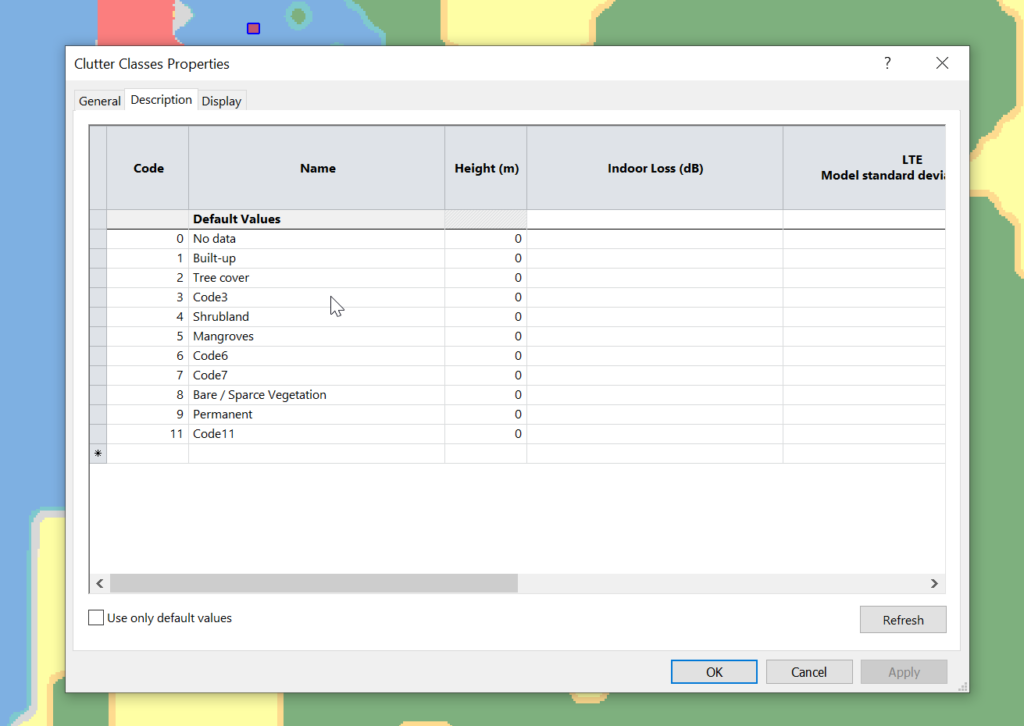
Right, now we’ve got the data but we don’t have any values.
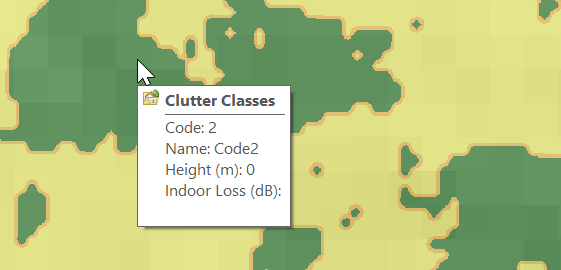
Each color represents a clutter class, but we haven’t set any actual height or losses for that material.
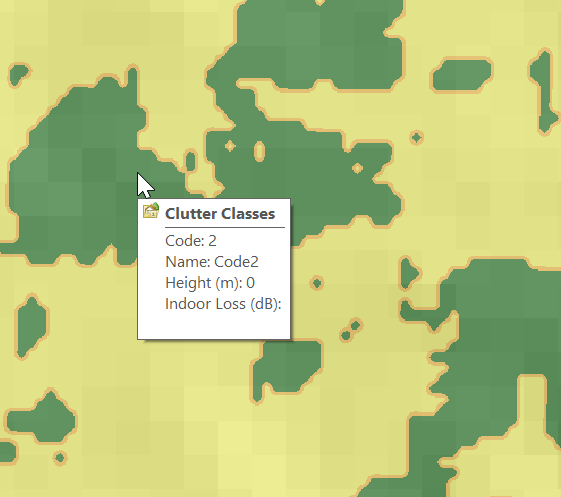
Alas the Map Code does not match with the table in the manual, but the colours do, here’s what mine map to:
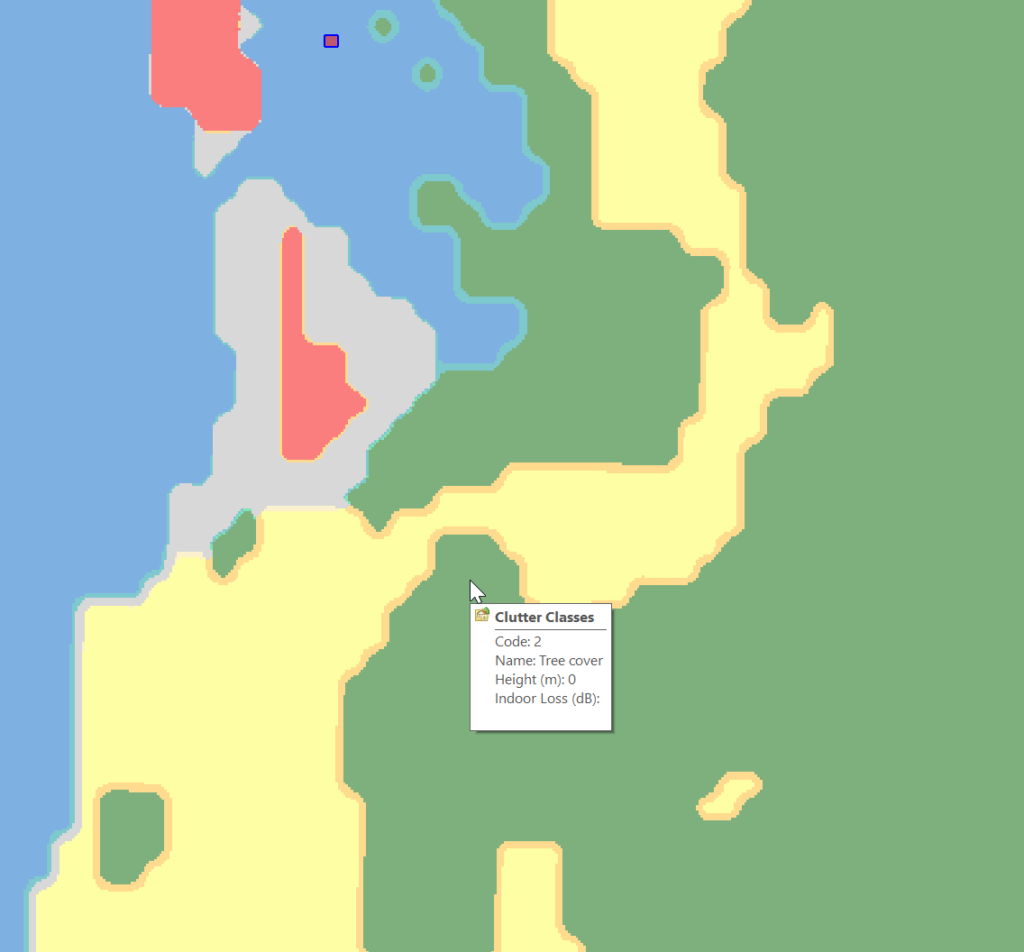
Which means when hovering over a layer of clutter I can see the type:
Next we need to populate the heights, indoor and outdoor losses for that given clutter. This is a little more tricky as it’s going to vary geography to geography, but there’s indicative loss numbers available online pretty easily.
Once you’ve got that plugged in you can run your predictions and off you go!
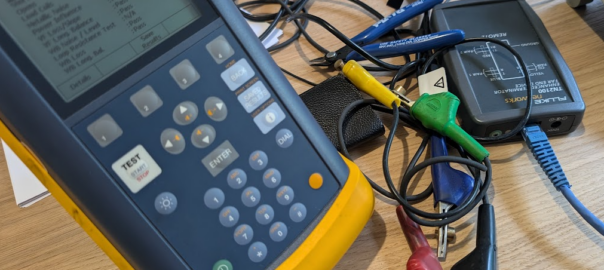
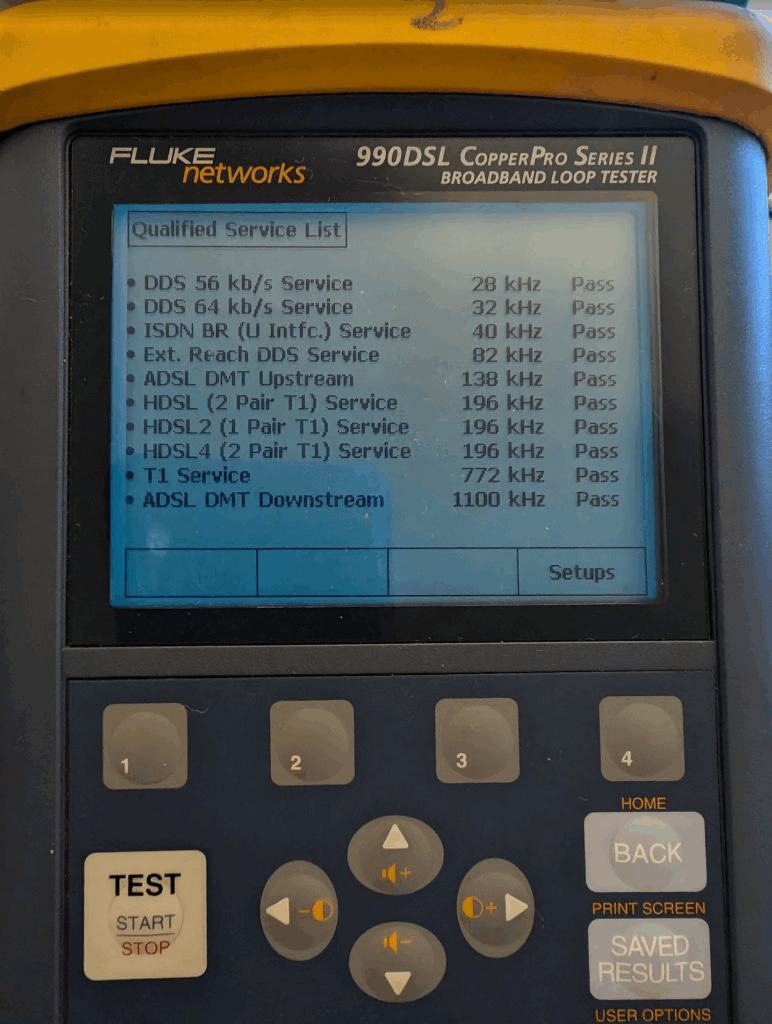
Because I’m a sucker for accessories for tools, I bought a Fluke TN2100 “Enhanced Terminator Far End Device”.
This device was made to go with the Fluke CopperPro Series II (Aka Fluke 990DSL), and is required for doing certain qualifications on the line, such as profiling the behavior of the line at different frequencies, wideband noise levels, etc.
This is all to qualify the quality of a loop / pair (or pairs – Can do up to 2 pairs / 4 cables) as being capable of supporting a variety of services like A/V/DSL as well as E1s / ISDN services, EMF, etc, etc.
It’s a super useful feature, if your loop is rubbish, putting an E1 circuit on it will end up with a high bit-error-rate, and putting a DSL circuit on it will see it constantly loose sync, so being able to qualify if the loop is any good beforehand is a must.
Alas the unit I’ve got came from eBay, and didn’t come with the leads, there’s just an RJ45 port on the terminator, with no indication as to what’s what.
So here’s the answer (which isn’t in any manual I could find) which I found through trial-and-error and cracking the case open to work out what was what:
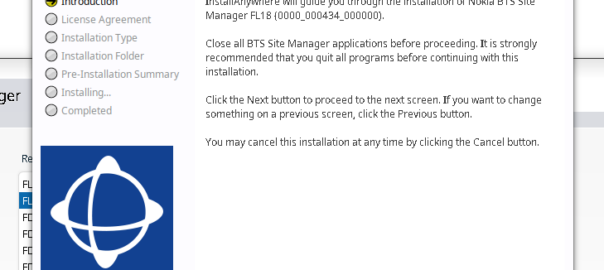
Another post in the “vendors thought Java would last forever but the web would just a fad” series, this one on getting Nokia BTS Site Manager (which is used to administer the pre-Airscale Nokia base stations) running on a modern Linux distro.
For starters we get the installers (you’ll need to get these from Nokia), and install openjdk-8-jre using whichever package manager your distro supports.
Once that’s installed, then extract the installer folder (Like BTS Site Manager FL18_BTSSM_0000_000434_000000-20250323T000206Z-001.zip).
Inside the extracted folder we’ve got a path like:
BTS Site Manager FL18_BTSSM_0000_000434_000000-20250323T000206Z-001/BTS Site Manager FL18_BTSSM_0000_000434_000000/C_Element/SE_UICA/Setup
The Setup folder contains a bunch of binaries.
We make these executable:
chmod +x BTSSiteEM-FL18-0000_000434_000000*
Then run the binary:
sudo ./BTSSiteEM-FL18-0000_000434_000000_x64.bin
By default it installs to /opt/Nokia/Managers/BTS\ Site/BTS\ Site\ Manager
And we’re done. Your OS may or may not have built a link to the app in your “start menu” / launcher.
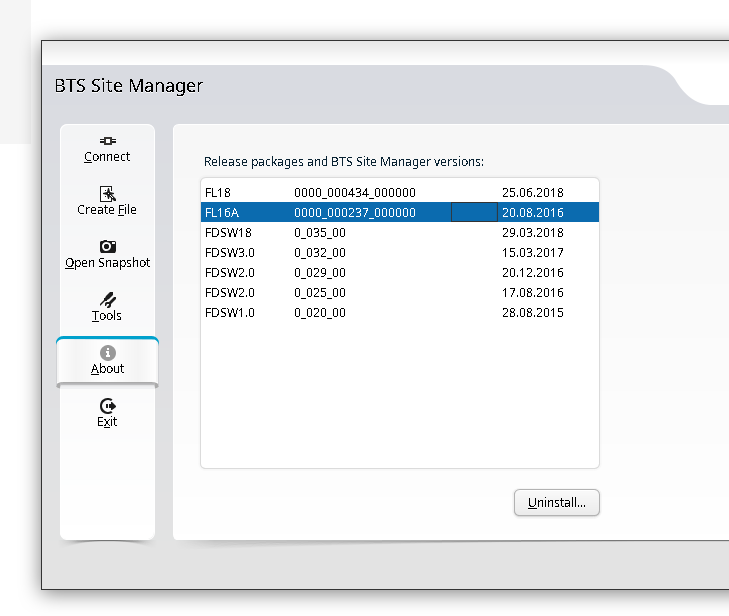
You can use one BTS manager to manage several different versions of software, but you need the definitions for those software loaded.
If you want to load the Releases for other versions (Like other FLF or FL releases) the simplest way is just to install the BTS site manager for those versions and just use the latest, then you’ll get the table of installed versions in the “About” section that you can administer.
Turns out it was great training for a career in telecom; I learned basic rigging, working at heights, electrical work, patching rats nests of cables and the shared camaraderie that comes from having stayed up all night working on something no one would ever notice, unless you hadn’t done it.
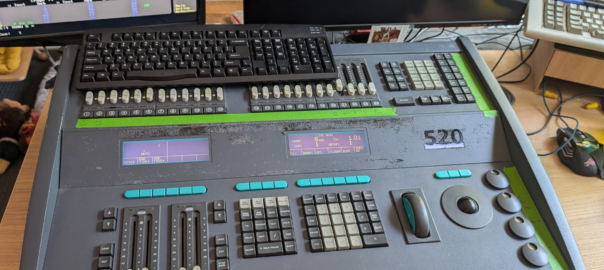
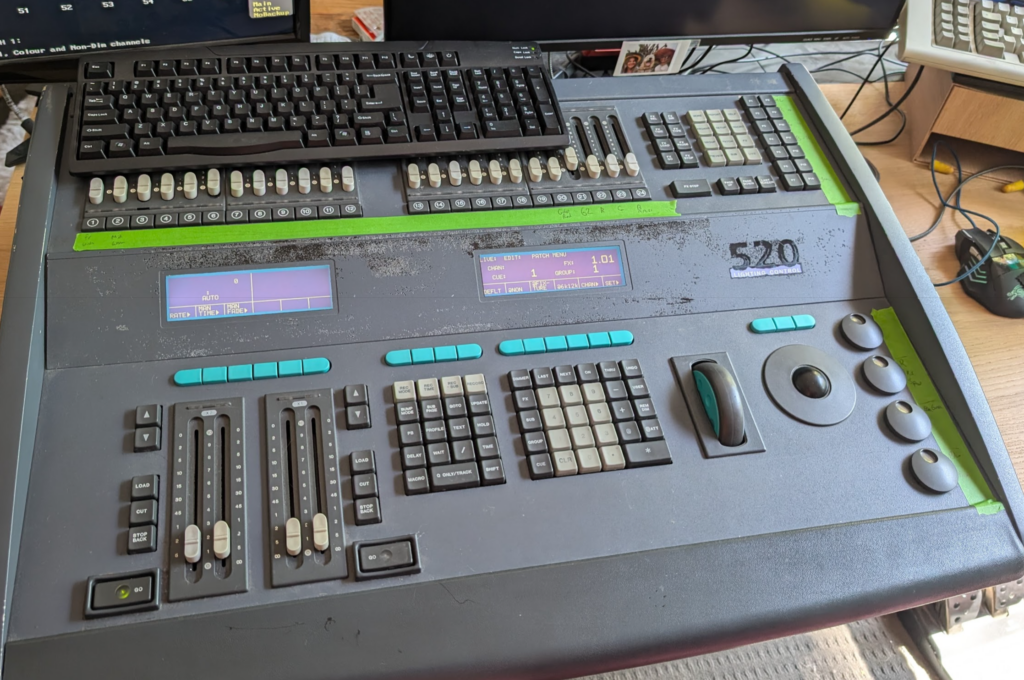
At the time the Strand 520i lighting console was the coolest thing ever, it had support for 4 DMX universes (2048 channels – Who could ever need more than that!?) and cost more than a new car.
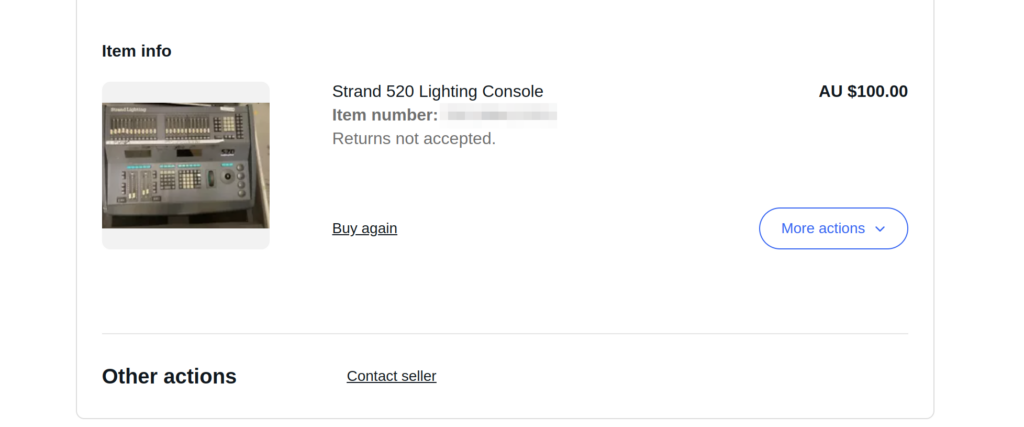
One late Friday night browsing online I found one for sale by a University in the state I live in, for $100 or best offer. You better believe I smashed the buy now button so hard my mouse almost broke. I was going to own my very own Strand 520.
I spent the weekend reading through the old manuals, remembering how to use all the features, then dragged my partner for the road trip the following Monday morning to pick it up and bring it home.
But before I could do anything fun I had to find a PS/2 keyboard and a VGA screen, which took me a few more days (a visit to the tip was the easiest way to get a hold of them).
Then I needed something to receive DMX – I found everything now uses ArtNet (DMX over IP) and there’s visualisers for simulating an arena / stage lighting setup, but all take ArtNet now, so I ordered a DMX to ArtNet converter.
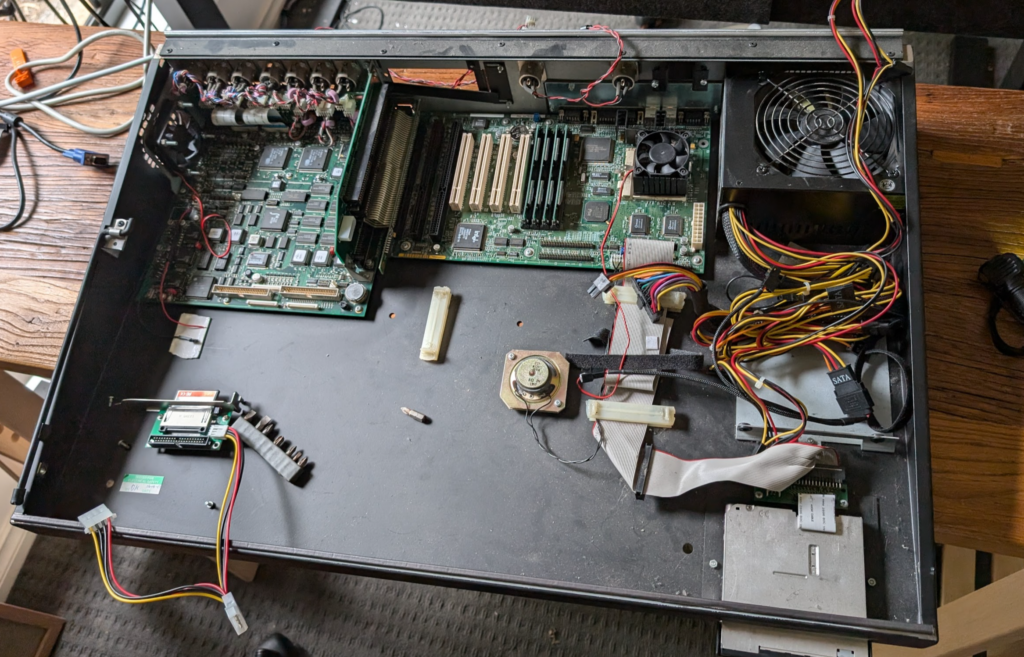
Inside the unit is pretty much a standard PC (An “OG” Pentium in the Strand 520) with an ISA card for all the lighting control stuff.
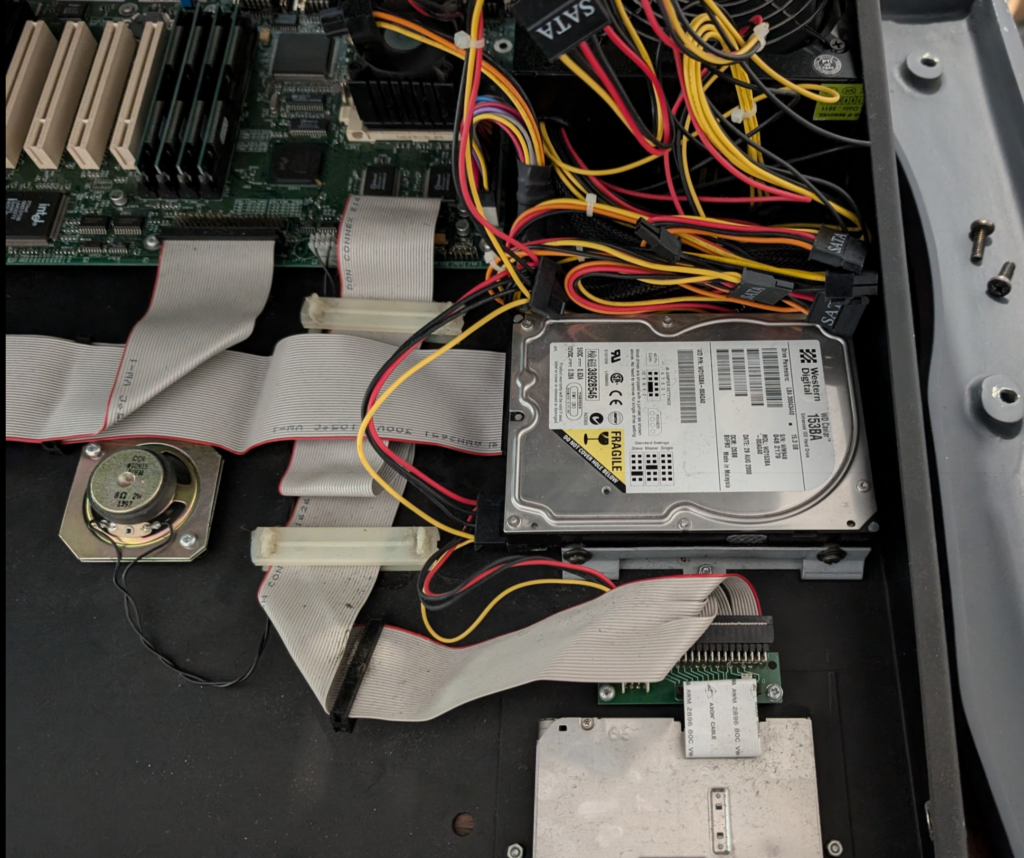
The clicking hard drive managed to boot, but I didn’t think it’d last long, having been made more than 25 years prior. So I created a disk image and copied the file system onto a CF card using a CF to IDE adapter. This trick meant it booted faster than ever before.
Clicky HDD before it became a CF
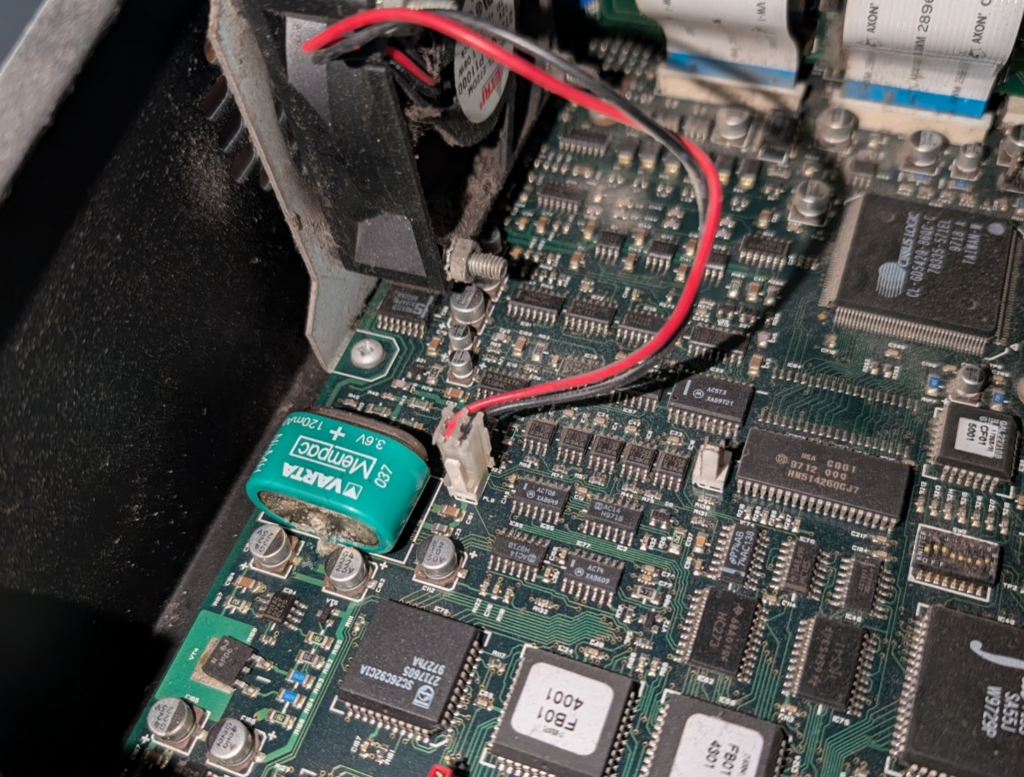
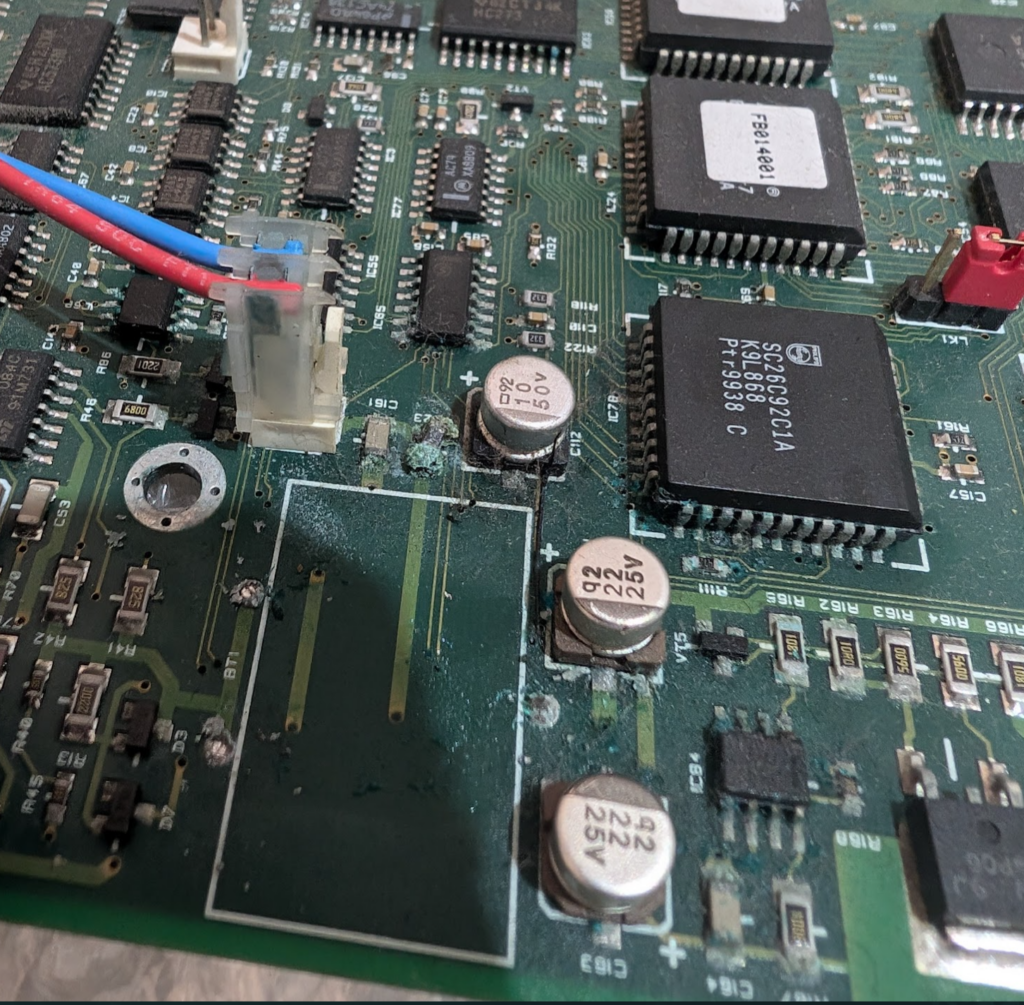
One thing I’d read about online was the VARTA battery had a tendency to leak battery acid all over the PCB. This one had yet to fully spill its guts, but was looking a bit bulgey and had started to leak a little already.
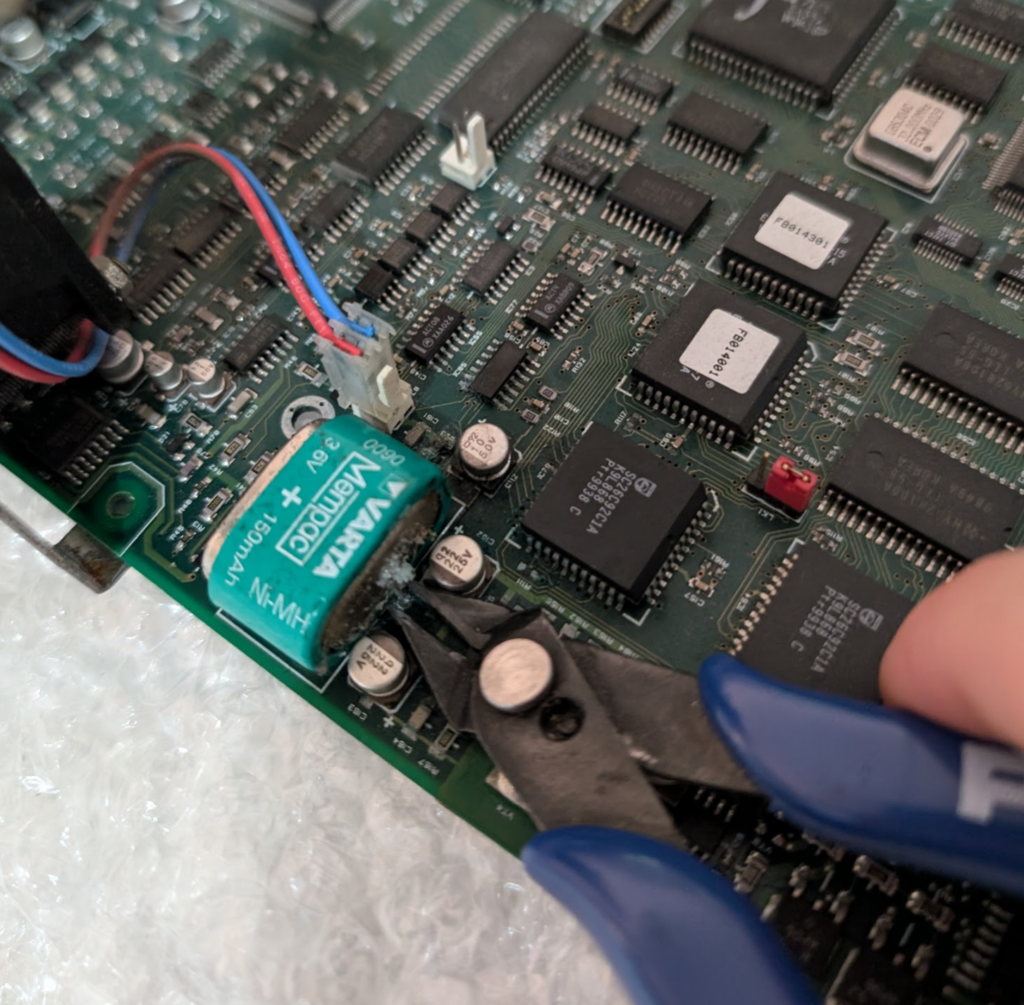
The battery (I’d read) was only for storing info in a power loss scenario, and if the battery isn’t present it just slows the boot time as everything has to be read from disk, so I took the leap of faith and cut the battery out, and lo, it still all boots.
Slightly furry VARTA battery
So now I was OK to get the desk online properly, but was getting semi-regular lock ups where DMX would stop outputting and inputs on the console were not read, but the underlying PC was still working.
I spent a lot time debugging this. BIOS settings, interrupts, I dived into how ISA works, replaced the battery I removed with a brand new one, and at one point I broke out the oscilloscope, but nothing worked.
Around the same time I noticed the Ethernet port (BNC!) would work if I just ran plain DOS (could ping from DOS but when the application started the NIC would go dead), which made me think I may be facing a hardware fault with the “CS” – the show processor for the console which is what the motherboard connects to via ISA.
The desk itself with the face off, and the CF adapter being mounted
Alas being almost 30 years old (this unit was made in 1996) there aren’t a great number of them around to test with, so I could try swapping out the “CS” board. What I did find was another complete console on eBay for $50 but it was in the UK, and they weigh a lot. Shipping this thing was not an option.
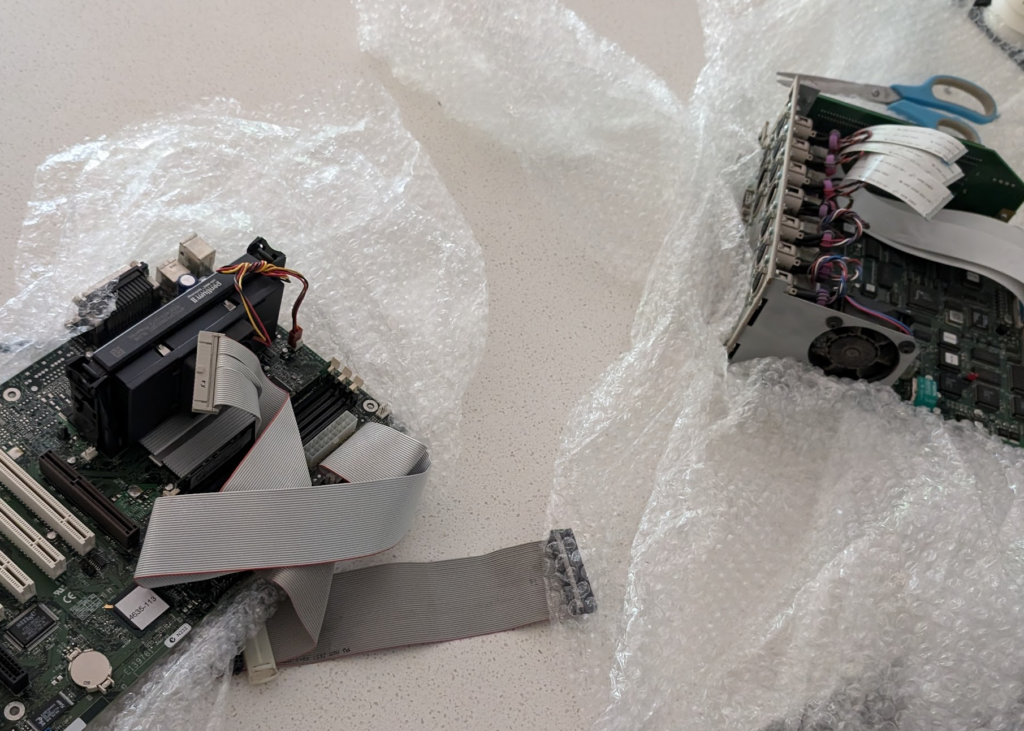
But for a bit of of extra cash the seller was willing to crack the case open and strip out the two main boards and post me just those. This had added bonus that the motherboard and CPU of the board sent from the UK was a 520i meaning it has the Pentium II processor – This Strand 520 was now going to be a Strand 520i.
A month later a box appeared at my door containing the boards, but the battery on the CS board from the UK had well and truly spilled its guts, leaving some toxic sludge around all the components nearby. A can of PCB cleaner and a toothbrush (which I will not be using to brush teeth with anymore) and I’d cleaned it up as best I could, but the fan output from the board was well and truly dead, with some of the SMD components just eaten by the acid.
So I put everything back into the case and wired it up. The mounts for the Motherboard were slightly different, and the software that is used for the 520i is different from the 520 (without the i).
The HDD from the UK was unable to boot, but I was able to get it to spin up enough to copy off the ~5Mb of files I needed, then I did a fresh install of MS DOS and copied the installer for the StrandOS.
Finally fully functional
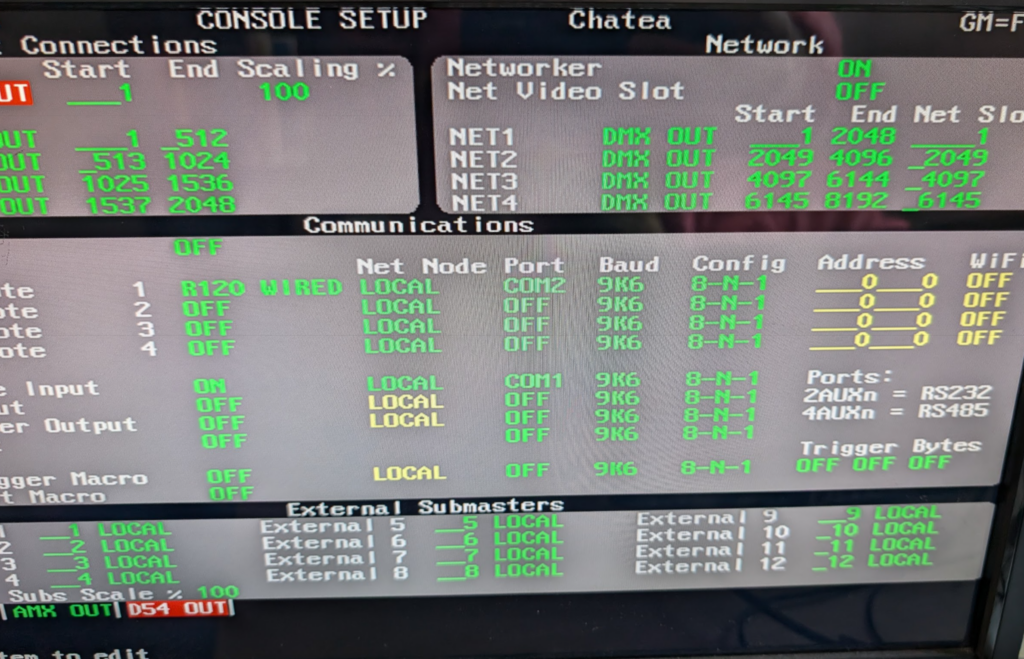
Finally I had a stable working console. Not just that but the Strand Networker application was now available to me. So I plugged into the 10Mbps connection and set the console to output to Network as well as DMX.
Enabling the “networker” for network DMX transmission
I cranked open Wireshark and there was a mystery signal sent to the broadcast address on UDP…
I patched a single DMX channel and changed the value and when I viewed the data in Wireshark I could see a hex representation of the DMX 0-255 value.
Easy I thought to myself, it’ll just be a grid of channels, each with their value as hex. Ha! I was wrong.
Turns out Strand Shownet used a conditional form of “Run Length Encoding” compression, where if you’ve got channels 1 through 5 at 50% rather than encoding this is 5 bytes each showing 0x80, it uses 2 bytes, to indicate 5 sequential channels (run length) and then the value (0x80). Then there’s another bit to denote how many forward places to move and if the next channel is using RLE or not.
The code got messy; it’s not the best thing I’ve ever written but it works for 2 full universes of DMX (I need to spend more time to understand where the channel encoding overflow happens as I end up a few channels ahead of where I should be on universe 3 and above).
The code is available on Github and I’d love to know if anyone’s using it with these old dinosaurs!
For the past few years I’ve run a Dell R630 as one of our labs / testing, it’s hosted down the road from me, and with 32 cores and 256 GB of RAM, it’s got enough grunt to run what we need for testing stuff on the East coast and messing around. We’ve got a proper DC with compute in Sydney and Perth, but for breaking stuff, I wanted my own lab.
This box started on VMware but after I’d see really odd disk IO behavior over a long period of time I couldn’t get to the bottom of.
Things would hang, for example you’d go to edit a file on a VM in vi and have to wait 20 seconds for the file to open, I could cat the same file instantly, and other files I could vi instantly.
I initially thought it was that dreaded issue with Ubuntu boxes being unable to revolve their own hostname and waiting for DNS to time out every. single. time. it. did. anything, but I ruled that out when I got the same behavior with live CDs and non Linux OSes.
In the end I narrowed it down to being related to Disk IO. I read Matt Liebowitz book on VMware VSphere Performance, assuming there was a setting somewhere inside VMware I had wrong.
But switching hypervisors didn’t fix the issue, so I could rule that out. So I splashed out and swapped the 16k magnetic SAS drives in the RAID with new SSDs, but still the problem persisted – It wasn’t the drives and I wasn’t seeing a marked increase in performance.
I did a bunch of turning on the PERC card with disk caching, write ahead, etc, but still the problem persisted.
At this stage I was looking at the PERC card or (less likely) the CPU/motherboard/RAM combo.
So over a quiet period, I moved some workloads back onto one of the old 16k magnetic SAS drives that I had pulled out to replace with the SSDs, and benchmarked the disk performance on the standalone SAS drive to compare against the RAID SSD performance.
I used iozone3 to benchmark the performance with:
iozone -t1 -i0 -i2 -r1k -s1g /tmp
Here’s how the SSDs in the RAID two compare to a standalone SAS drive (not in RAID):
Metric
LXC on SSD RAID
Standalone SAS Drive
Difference (Standalone vs. RAID)
Initial Write (Child)
314,682.91 kB/sec
382,771.88 kB/sec
+21.6%
Initial Write (Parent)
177,522.16 kB/sec
119,112.43 kB/sec
-32.9%
Rewrite (Child)
428,456.94 kB/sec
470,486.44 kB/sec
+9.8%
Rewrite (Parent)
180,007.46 kB/sec
73,721.11 kB/sec
-59.0%
Random Read (Child)
404,707.62 kB/sec
406,057.00 kB/sec
+0.3%
Random Read (Parent)
404,410.90 kB/sec
397,718.31 kB/sec
-1.7%
Random Write (Child)
126,042.59 kB/sec
355,304.22 kB/sec
+181.9%
Random Write (Parent)
4,497.75 kB/sec
68,971.35 kB/sec
+1,434%
That Random Write (Parent) at the bottom – Yeah that would explain the “weird” behavior I’ve been seeing on guest OSes. As part of editing a file with vi it creates a lock file, that would be written to a random sector, and thus taking such a long time (while cat wouldn’t do the same).
Okay – So now I know it’s the PERC at fault or the RAID config on it.
Next I put another SSD, the same type as those in the RAID, but as a standalone drive (Not in the RAID) and here’s the results:
Metric
RAID-15 SSD
SSD Standalone
Difference (WD vs. RAID-5)
Sequential Writes (Child)
314,682.91 kB/sec
511,280.50 kB/sec
+62.5%
Sequential Writes (Parent)
177,522.16 kB/sec
128,016.83 kB/sec
-27.9%
Sequential Rewrites (Child)
428,456.94 kB/sec
467,547.38 kB/sec
+9.1%
Sequential Rewrites (Parent)
180,007.46 kB/sec
79,698.26 kB/sec
-55.7%
Random Reads (Child)
404,707.62 kB/sec
439,705.72 kB/sec
+8.6%
Random Reads (Parent)
404,410.90 kB/sec
437,549.83 kB/sec
+8.2%
Random Writes (Child)
126,042.59 kB/sec
319,127.09 kB/sec
+153.2%
Random Writes (Parent)
4,497.75 kB/sec
125,458.00 kB/sec
+2,689.3% (!)
So sequential write and rewrites were slightly down on the standalone disk, but the other figures all look way better on the standalone SSD.
So that’s my problem, I figure it’s something to do with how the RAID is configured but after messing around for a few hours with all the permutations of settings I tried, I couldn’t get these figures to markedly improve.
As this is a lab box I’ll just dismantle the RAID and run each LXC container / VM on a local (non-RAID) SSD, as data loss from a dying disk is not a concern in my use case, but hopefully this might be of use to someone else seeing the same.
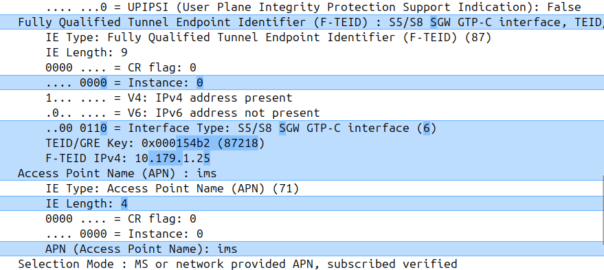
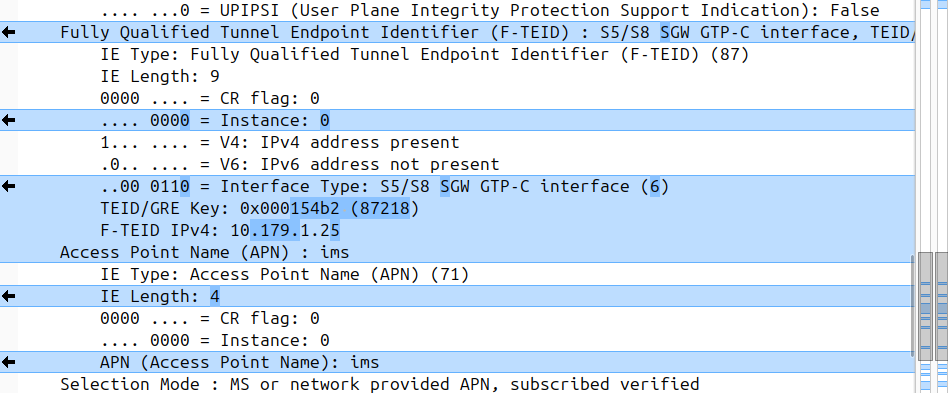
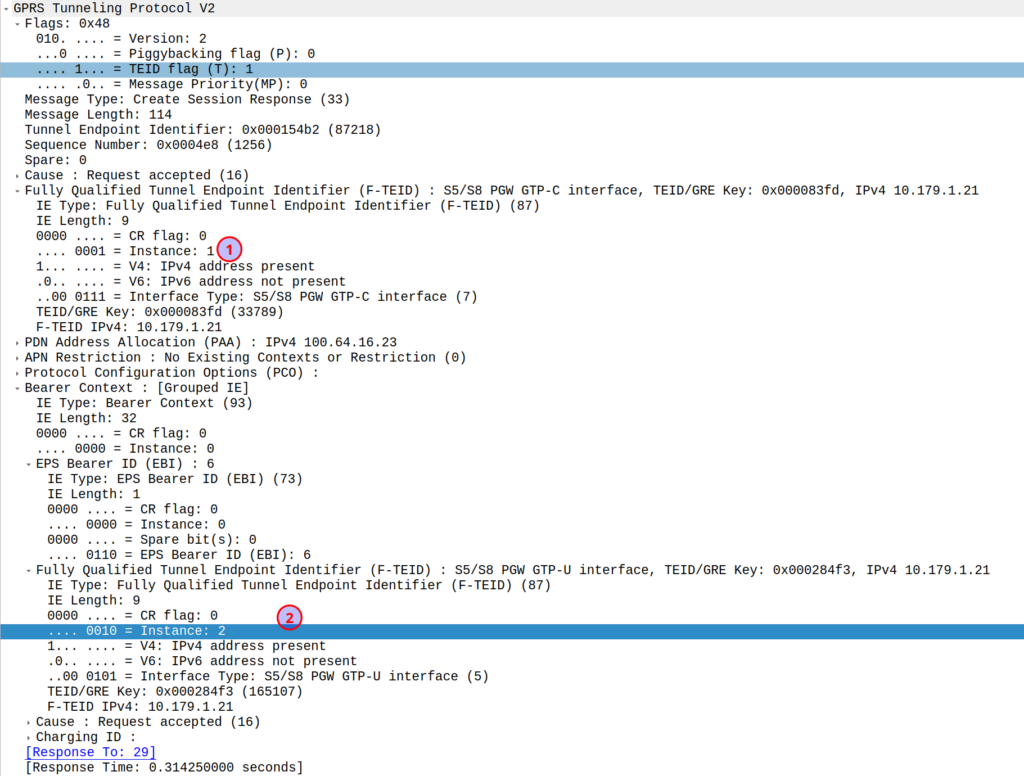
I was diffing two PCAPs the other day trying to work out what’s up, and noticed the Instance ID on a GTPv2 IE was different between the working and failing examples.
If more than one grouped information elements of the same type, but for a different purpose are sent with a message,
these IEs shall have different Instance values.
So if we’ve got two IEs of the same IE type (As we often do; F-TEIDs with IE Type 87 may have multiple instances in the same message each with different F-TEID interface types), then we differentiate between them by Instance ID.
The only exception to this rule is where we’ve got the same data, so if you’ve got one IE with the exact same values and purpose that exists twice inside the message.