I am connected on a VDSL line, not by choice, but here we are.
DSL is many things, but consistent it not one of them, so I thought it’d be interesting to graph out the SNR and the line rate of the connection.
This is an NBN FTTN circuit, I run Mikrotiks for the routing, but I have a Draytek Vigor 130 that acts as a dumb modem and connects to the Tik.
Draytek exposes this info via SNMP, but the OIDs / MIBs are not part of the standard Prometheus snmp_exporter, so I’ve added them into snmp_exporter.yaml and restarted the snmp_exporter service.
draytek:
  walk:
  - 1.3.6.1.2.1.10.94.1.1.3.1.8
  - 1.3.6.1.2.1.10.94.1.1.3.1.4
  - 1.3.6.1.2.1.10.94.1.1.5.1.2.4
  - 1.3.6.1.2.1.10.94.1.1.4.1.2.4
  metrics:
  - name: Draytek_dsl_LineRate
    oid: 1.3.6.1.2.1.10.94.1.1.3.1.8
    type: gauge
    help: adslAtucCurrAttainableRate

  - name: Draytek_dsl_Linerate_Down
    oid: 1.3.6.1.2.1.10.94.1.1.4.1.2.4
    type: gauge
    help: Draytek_dsl_Linerate_Down

  - name: Draytek_dsl_Linerate_Up
    oid: 1.3.6.1.2.1.10.94.1.1.5.1.2.4
    type: gauge
    help: Draytek_dsl_Linerate_Up

  - name: Draytek_dsl_SNR
    oid: 1.3.6.1.2.1.10.94.1.1.3.1.4
    type: gauge
    help: adslAturCurrSnrMgn
Then I added this as a target in Prometheus:
  - job_name: Draytek Logger
    scrape_interval: 1m
    scrape_timeout: 30s
    static_configs:
          - targets: ['10.0.2.1']  # My modem

    metrics_path: /snmp
    params:
      module: ['draytek']
    relabel_configs:
      - source_labels: [__address__]
        target_label: __param_target
      - source_labels: [__param_target]
        target_label: instance
      - target_label: __address__
        replacement: localhost:9116  # SNMP exporter address
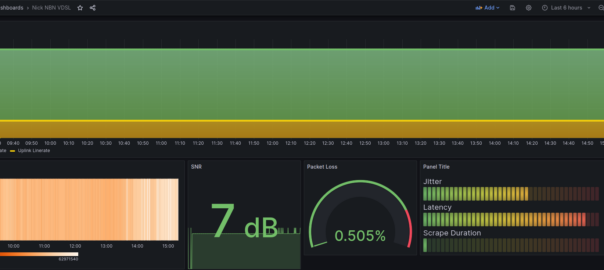
And then from Grafana I can quantify exactly how bad my line is over time!
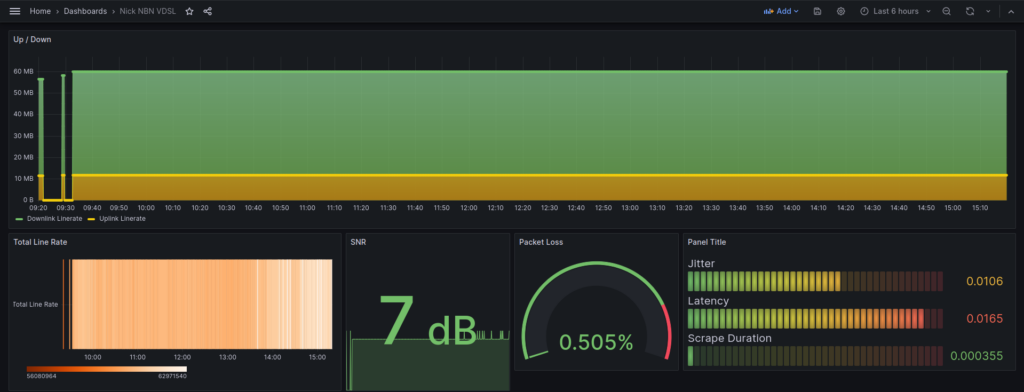
Only two dropouts today!